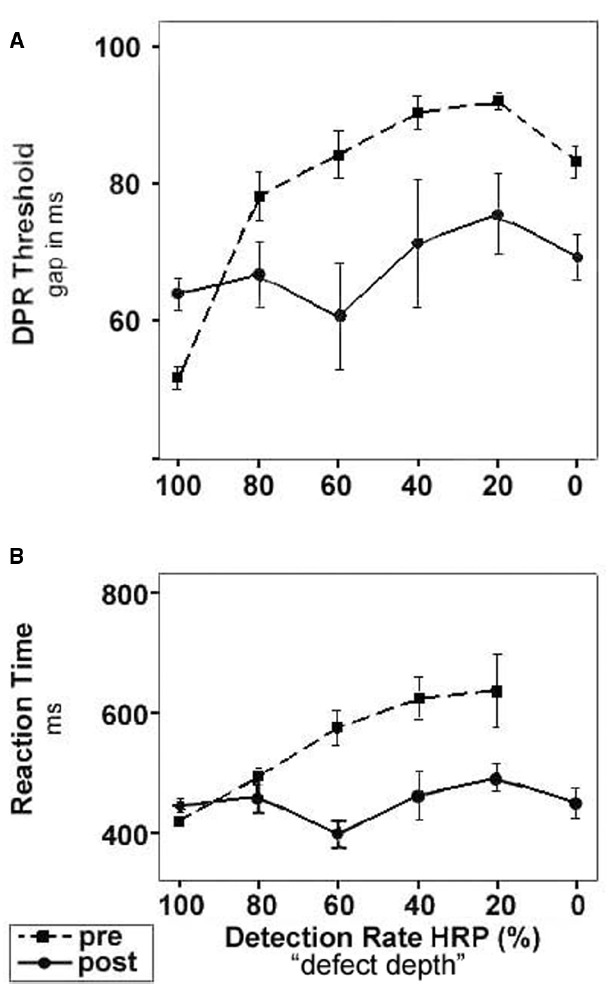
FIGURE 4.

DPR threshold and RT improvement depends on defect depth of visual field region. Dashed lines with square symbols: before training; solid lines with circle symbols, after training. Categorization of visual field regions was based on pre-training baseline measurements: areas with 100% detection rate were considered intact; areas of 0% detection probability were considered blind. Regions of intermediate detection performance of 20–80% were defined as areas of residual vision. (A) DPR thresholds before and after training plotted as mean (±SEM) over visual field regions with different defect depth. The most intense improvement of DPR thresholds was found in areas of residual vision. (B) RTs before and after training plotted as mean (±SEM) over visual field regions with different defect depth. The largest reduction of RTs was observed in areas of residual vision. Note that RT cannot be determined in blind areas. After training, RTs could be measured in areas which had been blind at baseline and which had partially recovered.
