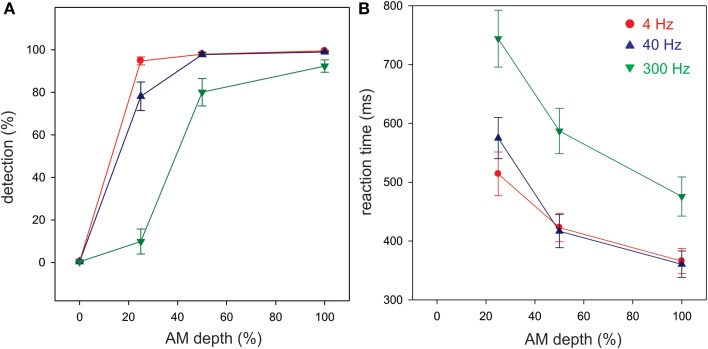
Figure 2.
Behavioral detection rates (A) and reaction times (B) in the attend ACC condition. All three AM rates are overlaid. Each ACC stimulus was presented 100 times and the detection rates represent the proportion of the stimuli that were detected over 100 repetitions. Shown are the mean detection and reaction times across all 10 participants. Note that the 4 and 40 Hz AM stimuli were more detectable than the 300 Hz particularly with lower AM depths. The overall reaction time to 300 Hz AM was reduced compared to 4 and 40 Hz. Errors bars: standard error of the mean.

