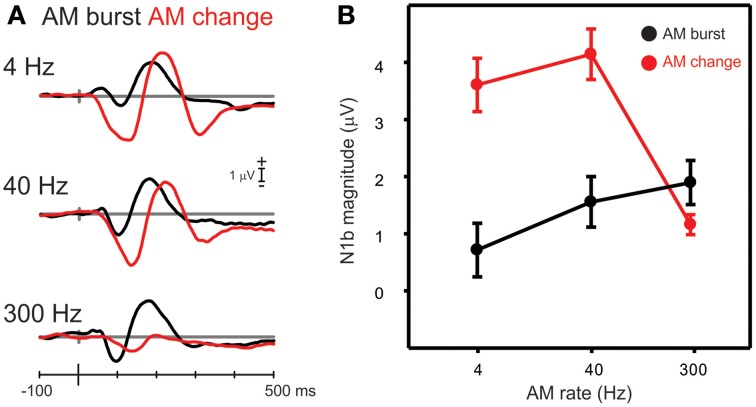
Figure 6.
A comparison of N1b responses to AM change with AM burst. (A) Shows the grand mean waveforms while (B) shows the mean N1b response over a 20 ms window for all participants. Note the AM change responses were larger than the AM burst for 4 and 40 Hz AM, but not with 300 Hz. Errors bars: standard error of the mean.

