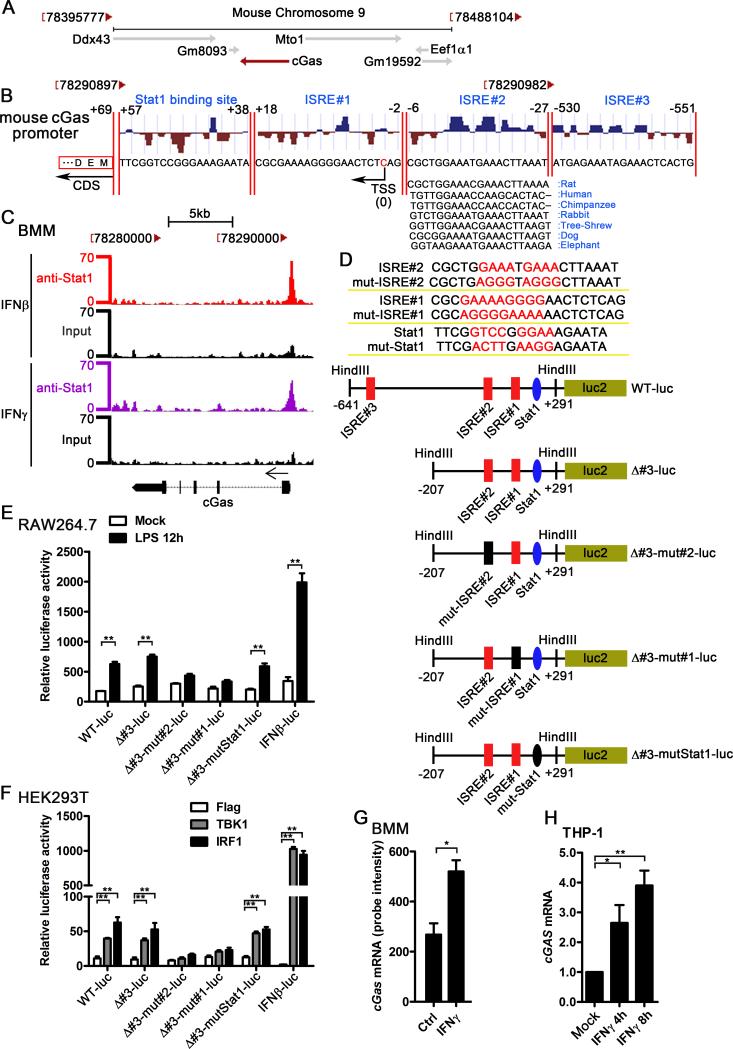
Figure 3.
The ISREs in the cGAS promoter mediate the induction of cGAS by IFN-I. A, the chromosome location of mouse cGas and its nearby genes, the diagram was modified from NCBI gene (Gene ID: 214763). B, the potential ISREs and STAT1 binding site in the promoter of cGas, transcription factor binding site prediction was performed by MatInspector. The location of the ISREs and STAT1 binding site and the conservation score were shown. The conservation comparison of ISRE#2 between human, rat, chimpanzee, rabbit, tree-shrew, dog, and elephant was according to the sequence from UCSC Genome Browser. TSS: transcription start site; CDS: coding DNA sequence. C, BMMs were treated with 100 U/ml IFNβ and IFNγ for 6 h, STAT1 ChIP-Seq data were analyzed and the Stat1 binding region in mouse cGas promoter was shown. The Stat1 ChIP-Seq raw data were downloaded from GEO (accession no. GSE33913). D, the sequence of the mutated ISRE#2, mutated ISRE#1, mutated Stat1, and the schematic diagram of the cGAS promoter reporter plasmids. E, indicated cGAS promoter reporter constructs or IFNβ luciferase reporter (IFNβ-luc) which expressing firefly luciferase was transfected into RAW264.7 cells by nucleofection system. pRL-TK-luc vector expressing Renilla luciferase was cotransfected as a control for transfection efficiency. Data were shown as the relative luciferase activity. F, Flag, TBK1, or IRF1 was cotransfected with indicated promoter reporter constructs and pRL-TK-luc vector. Data were shown as the relative luciferase activity. G, BMMs were treated with 1 U/ml IFNγ for 2.5 h, RNA was extracted and gene expression profile was detected by Affimetrix430.2 Chip, cGas mRNA level was shown as probe intensity from microarray. H, THP-1 cells were treated with human recombinant IFNγ (100 U/ml) for indicated time points. cGAS mRNA level in these cells was measured by qPCR and normalized to RPL32. Data of (E) and (F) are from one representative experiment (mean ± s.d., n=6), **p<0.01 (Student's t-test). Similar results were obtained in three independent experiments. Data of (G) and (H) are from three independent experiments (mean ± s.e.m), *p<0.05, **p<0.01 (Student's t-test).

