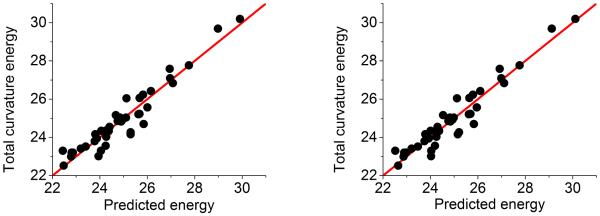
Figure 10.

Comparison between the distance filtration (left chart) and the correlation matrix filtration (right chart) in fullerene C40 stability analysis. Fullerene C40 has 40 isomers. Each of them has an associated total curvature energy (eV). We calculate our average accumulated bar lengths from both distance filtration and the correlation matrix based filtration, and further fit them with total curvature energies. The correlation coefficients for our fitting are 0.956 and 0.959, respectively. It should be noticed that only the central void related β2 bars (i.e., the long-lived bars) are considered. The exponential kernel is used in matrix filtration with parameter η = 4 and κ = 2.
