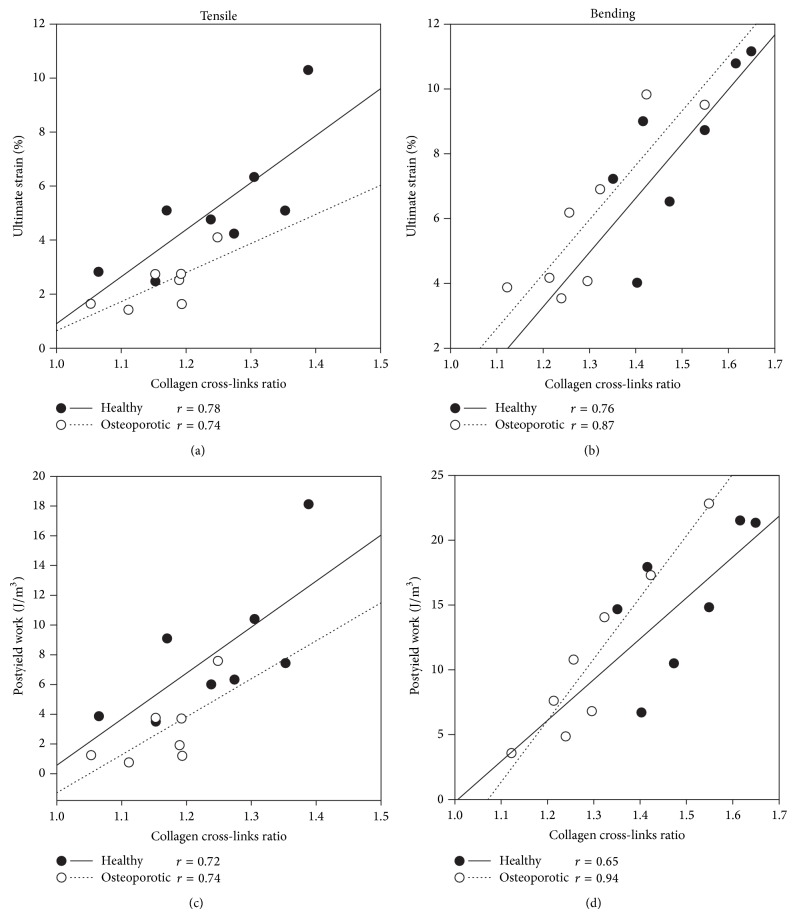
Figure 2.
Regression analysis for the two donors showing the ultimate strain and the postyield work versus the collagen cross-link ratio ((a)–(c) for tensile and (b)–(d) for bending data, resp.). Tensile and bending data are analyzed separately and the Pearson correlation coefficient is reported for each regression line (healthy donor: solid line; osteoporotic donor: dotted line). P values for all correlation coefficients are in the range of 0.011–0.048.

