Figure 3.

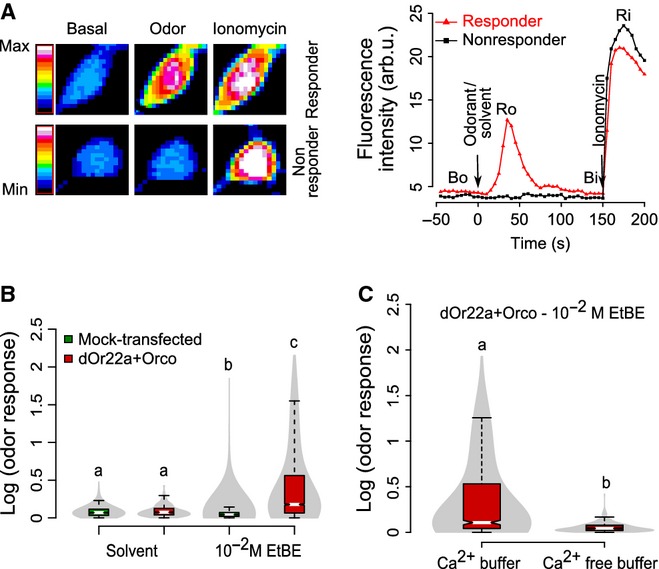
dORs expressed in HEK293T cells are functional. (A) Transfected HEK293T cells respond to odor stimulus. Mean fluorescence intensity change of a responder and a non-responder cell transfected with dORs to EtBE 10−2 m dilution is shown as a false color-coded picture (left) and as the time course (right) for each of the three stages of our calcium assay. Time points for Bo, Ro, Bi and Ri are shown. (B) Violin plot (combination of boxplot and kernel density distribution plot; boxplots were colored based on the group; the gray color indicates the probability density of the data) of the calcium response [log (odor response) = log (Ro/Bo)] of mock and dORs transfected cells to solvent (assay buffer, 348 ≤ n≤560 cells from ten independent experiments) or to odorant (EtBE 10−2 m, 1161 ≤ n≤6663 cells from 12 to 50 independent experiments). Medians with different letters differ significantly (Kruskal–Wallis test, P<2.2e-16, 348 ≤ n≤6663 cells). (C) Calcium-free buffer abolishes odor responses. Violin plot of odor-induced calcium response of transfected cells with (n = 537 cells from ten independent experiments) or without (n = 1411 cells from 20 independent experiments) the presence of calcium in extracellular buffer. Medians with different letters differ significantly (Mann–Whitney U test, P<2.2e-16, 537 ≤ n≤1411 cells).
