Figure 6.
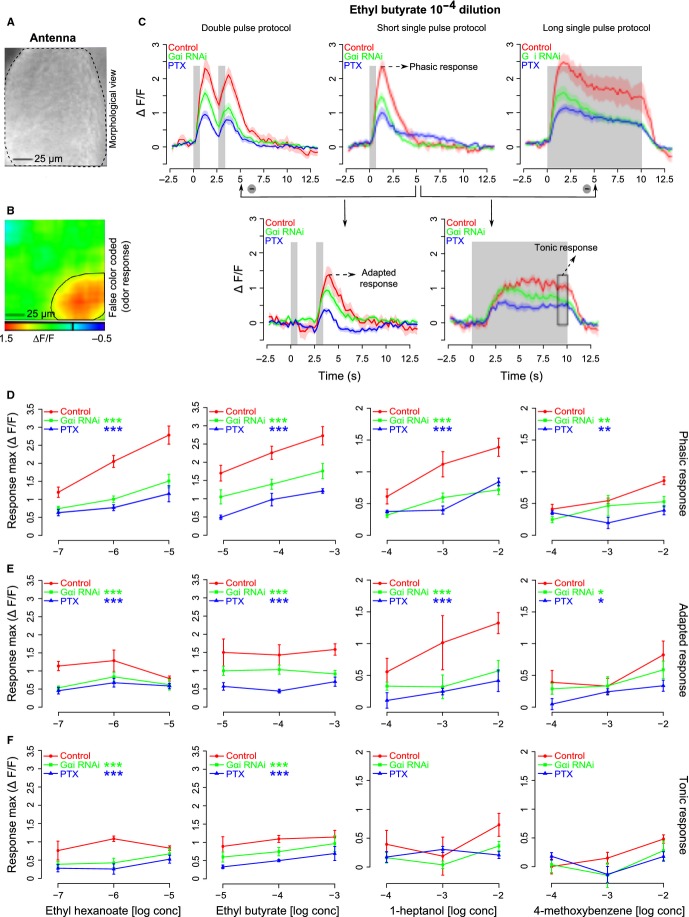
Odor-mediated calcium changes in the antenna of female flies are affected by the levels of Go/i subgroup of G proteins. (A) Morphological view of an antenna of a female Drosophila melanogaster; black dotted lines mark the margin of the antenna. Image was taken from a CCD camera. (B) False color-coded picture of the response to ethyl butyrate 10−5 m dilution measured on the antenna; the black circle indicates the area from which responses were calculated. Orientation as in A. (C) Mean traces of response to ethyl butyrate 10−4 m dilution for different stimulation protocols and genotypes tested (shading indicates SEM, n = 5–7 flies for every genotype). Gray bars in the plot indicate the time and duration of odor delivery. Red, green and blue colors indicate control, Gαi RNAi (downregulation of Gαi) and PTX (reduction of Gαo) groups of flies, respectively, and the color coding is maintained throughout the figure. Response magnitudes of the phasic response, adapted response and tonic response were calculated from the traces labeled with the same names (for more details see Materials and methods). (D–F) Dose–response curves (mean ± SEM) for the phasic response, adapted response and tonic response, respectively, for ethyl hexanoate (left most), ethyl butyrate (middle left), 1-heptanol (middle right) and 4-methoxy benzene (right most) to the genotypes tested. Asterisks indicate statistical significance compared with the control group for all the concentrations tested, two-way anova (treatment and concentration are used as factors; ***P<0.001, **P<0.01, *P = 0.05, n = 5–7 flies for every genotype).

