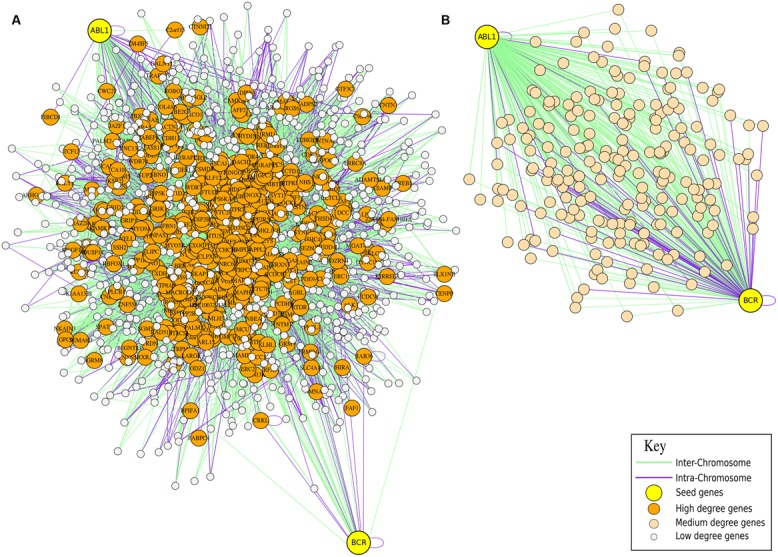
FIGURE 2.

Hi–C for Cytogenetic application. Comparison of FISH data and Hi–C information for the cytogenetic analysis of translocation in leukemia. In panel (A) the neighborhood graph of the genes ABL1 and BCR generated from the GM06990 cell line (Lieberman-Aiden experiment SRA:SRR027956) is presented. The graph shows that in normal cells the genes are not directly in contact since other genes are placed between them. In panel (B) the neighborhood graph of the genes ABL1 and BCR from the K562 cell line (Lieberman-Aiden experiment SRA:SRR027962) is presented. The graph shows that in cancer cells the genes are closer one to the other, which is a preliminary evidence of a possible translocation.
