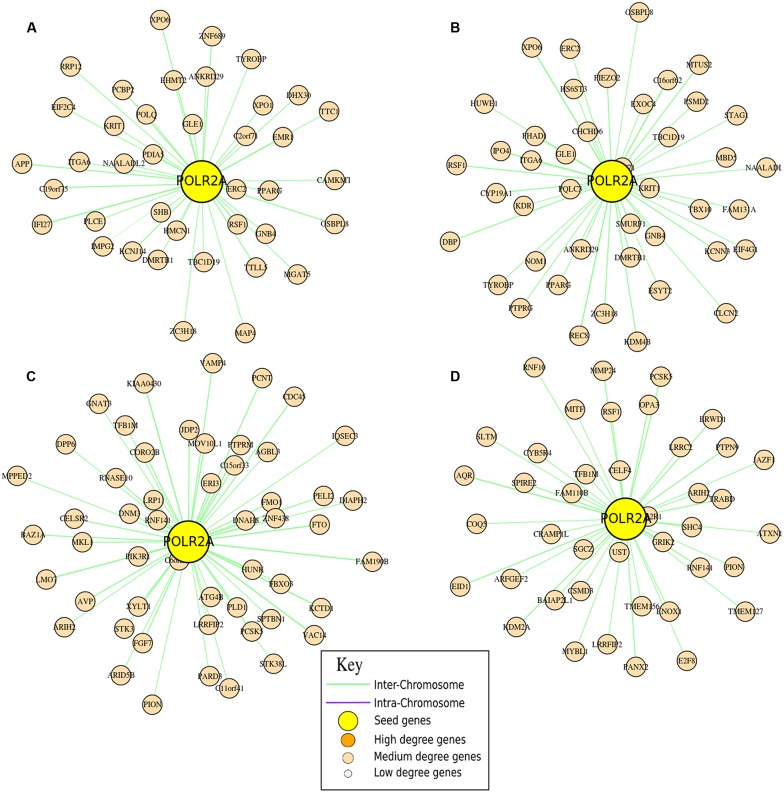
FIGURE 3.
Analysis of the nucleolus. Neighborhood graphs of the gene POLR2A in four different runs from the Hi–C experiments of Dixon et al. (2012) to show inter and intra run modifications of the chromatin conformation. Panels (A,B) concern sequencing runs from hESC (SRA:SRR400260, SRA:SRR400261), while data in panels (C,D) are from IMR90 (SRA: SRR400266, SRA:SRR400267). In these graphs, seed genes are the genes given as input to the algorithm, while output genes are differentially represented according to their importance (in terms of degree).

