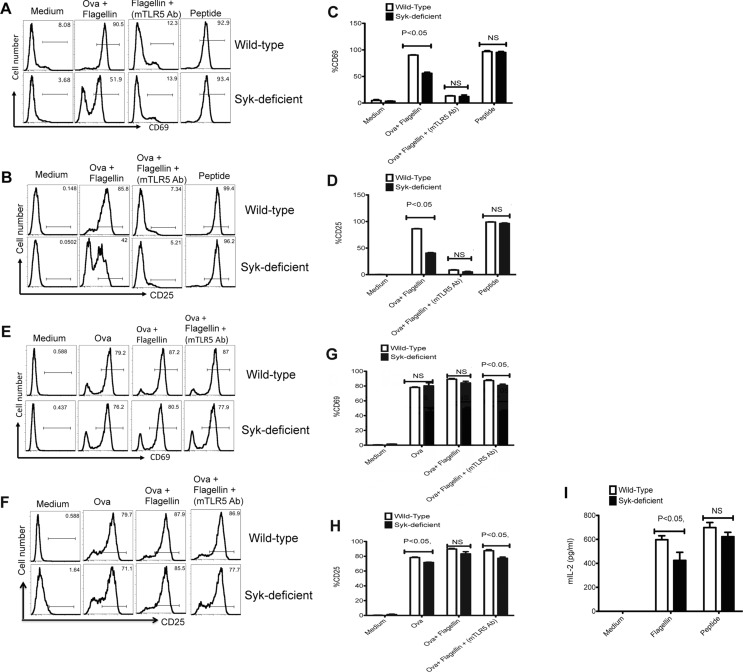
Figure 5.
Syk-deficient DCs display a specific deficiency in the activation of flagellin specific CD4+ T cells. CD11c+ DCs (1 × 10⁵) isolated from WT and Syk-deficient chimeric mice were either pretreated with monoclonal anti-TLR5 antibody for 60 min or left untreated and were then cultured with 1 × 10⁵ SM1 or OT-II T cells for 16 h in the presence of OVA (100 μg/mL), OVA (100 μg/mL) + flagellin (1 ng/mL), or flagellin peptide (6 μM). (A and B) Representative flow cytometry plots (n = 3 samples per group) show the expression of (A) CD69 and (B) CD25 on (CD4+CD90.1+) SM1 T cells. (C and D) The percentage of (C) CD69- and (D) CD25-expressing SM1 T cells as treated in (A and B). (E and F) Representative flow cytometry plots (n = 3 samples per group) show the expression of (E) CD69 and (F) CD25 on (CD4+CD90.1+) OT-II T cells cultured with treated CD11c+ DCs enriched from spleen of WT and Syk-deficient chimeric mice as described above. (G and H) The percentage of (G) CD69- and (H) CD25-expressing OT-II T cells as treated in (E and H). (I) IL-2 concentration was measured in the culture supernatant of DC T-cell coculture experiments (16 h) by ELISA. (C, D, G, H, I) Data are shown as mean + SEM of three samples per group, and are from one experiment representative of three independent experiments. NS: nonsignificant by unpaired t-test.

