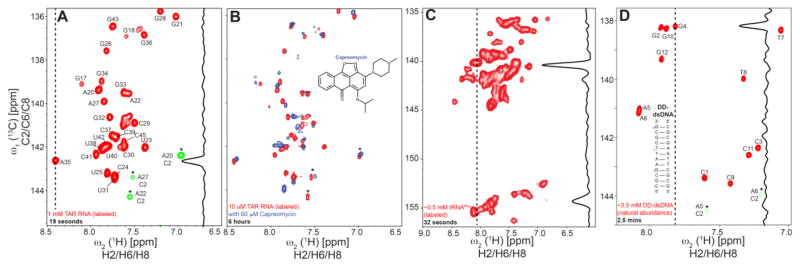
Fig 2.

Aromatic 2D SOFAST-HMQC spectra acquired for 1 mM (A) and 10 μM (B) samples of uniformly 13C/15N labeled TAR, with a total measurement time of 19 seconds and 6 hours, respectively. The 1D trace across 1(13C) for A35 in (A) reflects the high intrinsic sensitivity of the experiment. The relatively lower sensitivity of the adenine C2-H2 peaks, folded over in the chosen spectral window (peaks denoted with *), indicate the longer T1 experienced by H2 spins as against H6/H8. In (B) the binding of Capreomycin, a small molecule computationally predicted to bind TAR RNA, to 10 μM uniformly 13C/15N labeled TAR sample is shown (in blue) illustrating the applicability of aromatic SOFAST-HMQC towards small molecule screening and also in sensitivity-limited cases. Folded peaks are denoted by (*) and colored same to maintain simplicity. (C) and (D) 2D aromatic SOFAST-HMQC spectra acquired within a measurement time of 32 seconds and 2.5 minutes for 0.5 mM uniformly 13C/15N labeled tRNAPhe and 3.5 mM unlabeled palindromic DD-dsDNA, respectively.
