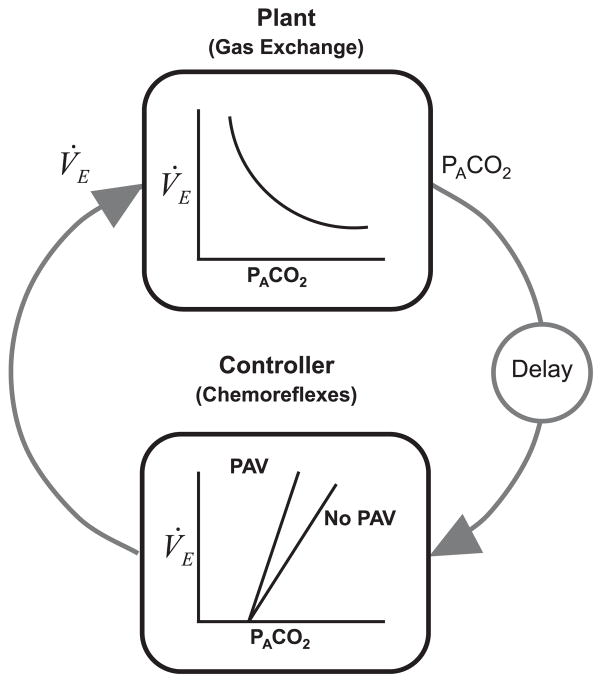
Fig. 1.
Schematic diagram of the respiratory control system. The plant represents the gas-exchange system. The input to the plant is ventilation (V˙E), and the output is the alveolar gas tension (PACO2). The delay term represents the time it takes for the pulmonary capillary blood to reach the chemoreceptors. During sleep, the controller primarily represents the ventilatory response to CO2, i.e. chemorelfexes. PAV works by generating pressure at the airway in proportion to a person’s inspiratory effort, thereby resulting in an increase in controller gain. The product of the plant and controller gains equals the loop gain.

