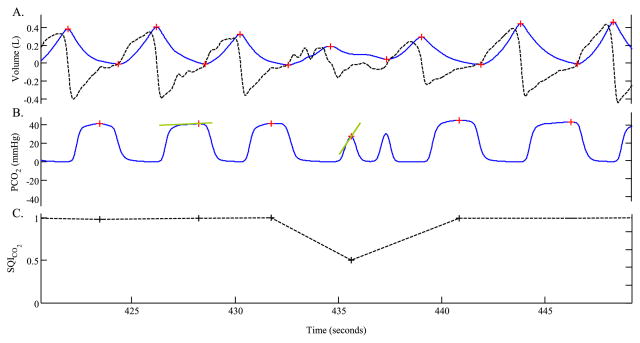
Fig. 3.
Signal quality index for CO2. Panel A shows a flow signal (dark, dotted line) and the corresponding tidal-volume signal (blue, solid line). Note that, the PETCO2 corresponding to breath #4 is about 28 mmHg. Such a sudden drop in PaCO2 is unlikely to be physiological. Breath #4, therefore, is assigned a low signal quality index, as shown in panel C.

