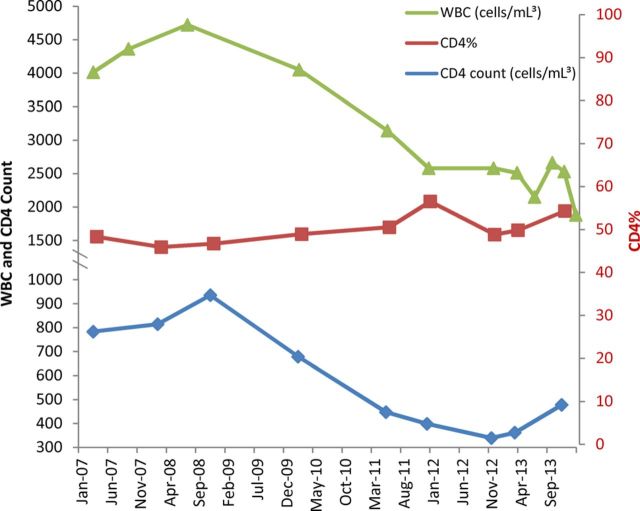
Figure 1.
The patient's absolute CD4 count, CD4 percentage (CD4%), and white blood cell (WBC) count since 2008. Absolute CD4 count and WBC count are plotted on the primary vertical axis (left) in cells/mL3, and the CD4% is plotted on the secondary vertical axis (right). The viral load is not plotted, but it was undetectable except for a one-time blip of 89 copies/mL3 in November 2012.

