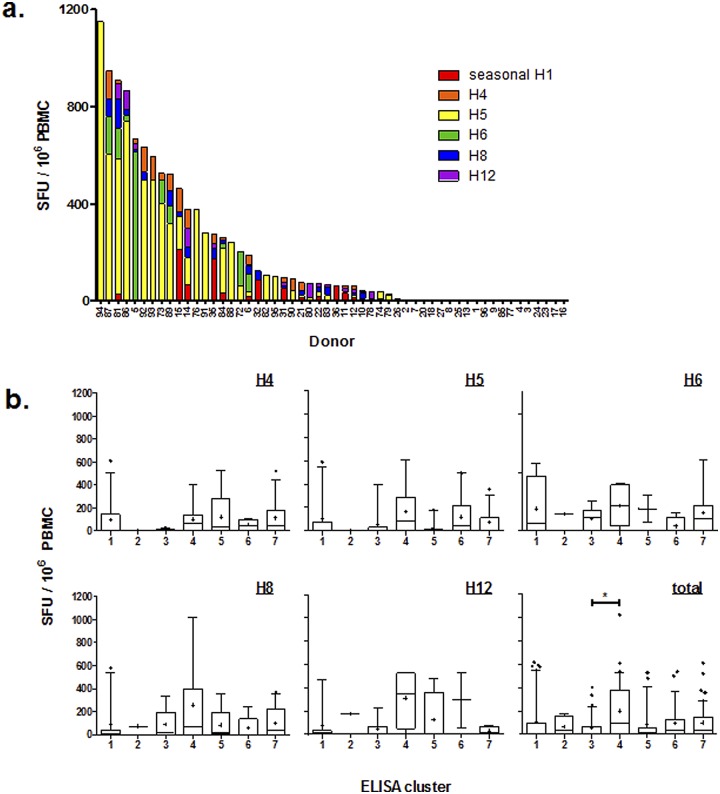
FIG 2 .
(a) The frequency distributions of participants with IFN-γ-producing cells as measured by ELISPOT assay to individual HA proteins are shown as spot-forming units (SFU) per million PBMCs. (b) Individual PBMC IFN-γ responses for each HA protein or total response to any HA protein are plotted by ELISA cluster. Frequencies have been corrected for background IFN-γ production in unstimulated control cultures.

