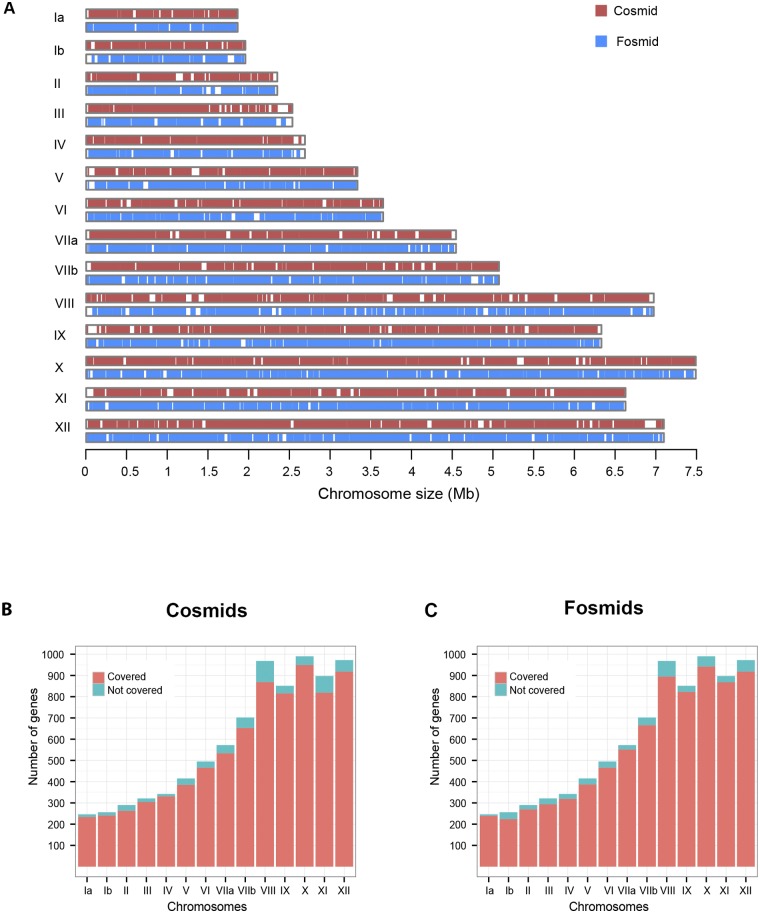
FIG 2 .
Comparison of coverages of T. gondii chromosomes by cosmids and fosmids. (A) Ideogram showing the regions of the T. gondii chromosomes covered by cosmids (red) and fosmids (blue). White spaces indicate no coverage. (B and C) Cosmids (B) and fosmids (C) mapping to genes on the 14 T. gondii chromosomes. The genes covered on each chromosome are shown in coral, whereas those that are not covered are shown in turquoise.

