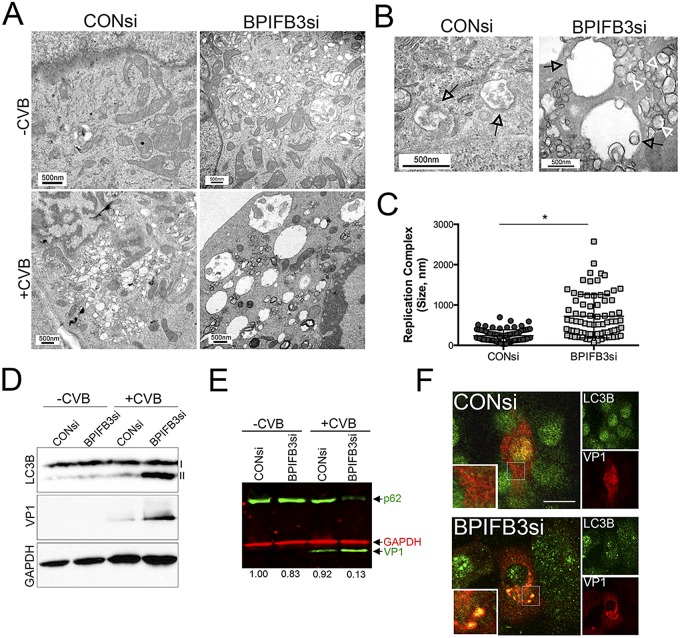
FIG 3 .
Silencing of BPIFB3 enhances autophagy during CVB infection. (A) Electron micrographs of uninfected (top row) or CVB-infected (3 PFU/cell for ~16 h) (bottom row) HBMEC transfected with CONsi (left panels) or BPIFB3si (right panels). (B) High-magnification images of CVB-induced replication organelles in HBMEC transfected with CONsi (left) or BPIFB3si (right). Black arrows denote replication organelles in CONsi-transfected cells or megaphagosomes in BPIFB3si-transfected cells. White arrows denote smaller, double-membrane-bound vesicles in BPIFB3si-transfected cells. (C) Size of CVB-induced replication organelles in cells transfected with CONsi or BPIFB3si, assessed by EM. A total of approximately 100 independent organelles from at least 20 unique cells were quantified. *, P < 0.001. (D) Immunoblots for LC3B (top), VP1 (middle), and GAPDH (bottom) in uninfected or CVB-infected HBMEC transfected with CONsi or BPIFB3si. I, nonlipidated LC3B; II, AP-associated LC3B. (E) Results of dual-color immunoblot analysis using a LI-COR Odyssey infrared imaging system and antibodies specific for p62 and VP1 (800 nm; green) and GAPDH (700 nm; red) in HBMEC transfected with CONsi or BPIFB3si and uninfected or infected with CVB (3 PFU/cell) for 24 h. Numbers at the bottom show densitometry results for the level of p62, normalized based on GAPDH levels, and presented as the fold change from uninfected CONsi-transfected cells. (F) HBMEC transfected with CONsi or BPIFB3si were infected with CVB for ~8 h and then fixed and stained for VP1 (in red) and LC3B (in green). Areas of colocalization appear in yellow. Bar, 10 µm.

