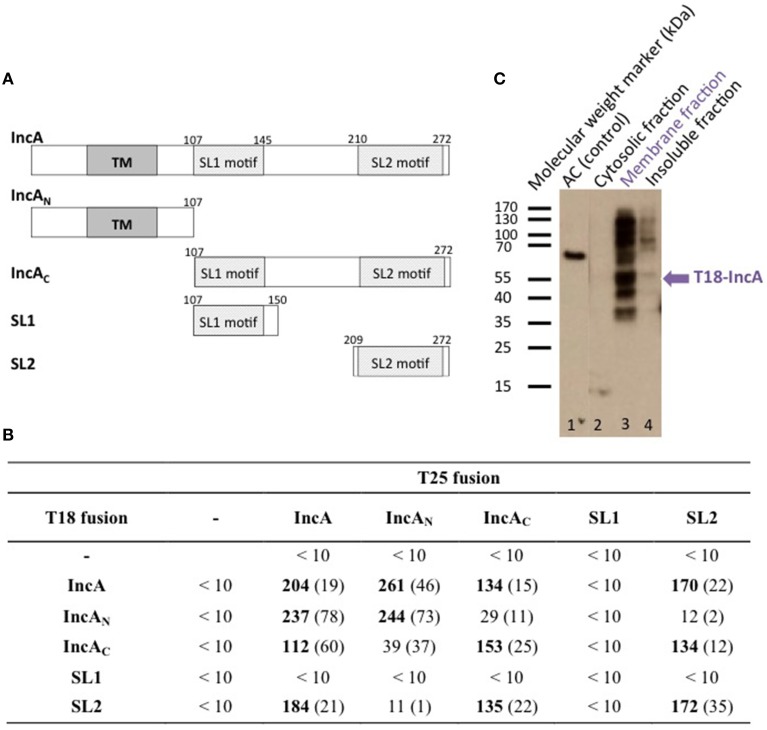
Figure 1.
BACTH analysis of C. trachomatis IncA and its sub-domains interactions. (A) Schematic representation of the different domains of IncA (Ct119), with numbers indicating the amino acid residues. TM designates the transmembrane domain and SL1 and SL2 the two SNARE-like motifs. (B) The β-galactosidase activity of DHT1 co-expressing the indicated fusion proteins was measured in liquid cultures as described in “Materials and Methods.” The reported values, expressed in relative units (RU), correspond to the average obtained from eight clones tested for each interaction with the standard deviation given in parentheses. The “-” corresponds to the empty vectors. (C) Western blot analysis of the subcellular localization of the T18-IncA protein in E. coli DHT1. Exponentially growing DHT1 cells, co-expressing the T25-IncA and T18-IncA fusion proteins, were collected, lysed by sonication, and fractionated by ultracentrifugation (see Material and Methods). Proteins from the soluble (2), membrane (3) or insoluble (4) fractions were separated by gel electrophoresis on a 12% SDS-gel, transferred onto a PVDF membrane, and revealed with an anti-T18 monoclonal antibody (3D1). Positions of molecular weight markers (in kDa) are indicated on the left of the Figure while the expected position of T18-IncA is indicated by a blue arrow. In lane 1, a polypeptide corresponding to a 65 kDa fragment of CyaA adenylate cyclase (AC65) was run as a positive control for the anti-T18 antibody detection.

