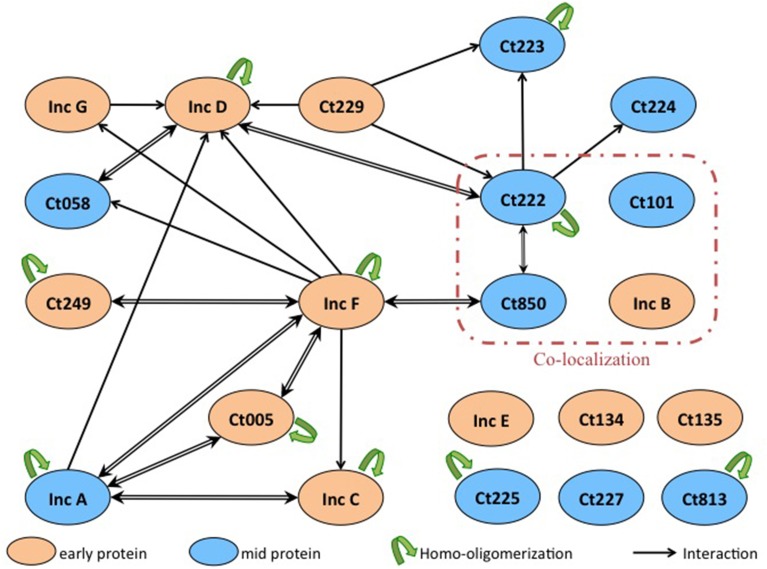
Figure 5.
Interaction network among Inc proteins. Schematic overview of the interactions between the Inc proteins that are colored according to their developmental expression pattern: orange for early genes and blue for mid genes. The interactions identified in this work are indicated with black arrows (the arrow pointing toward the T18-fusion indicates an interaction with a corresponding T25-fusion), and the homo-oligomerizations are shown by green arrows. Proteins reported to co-localize in Mital et al.'s experiment are surrounded with a red line.

