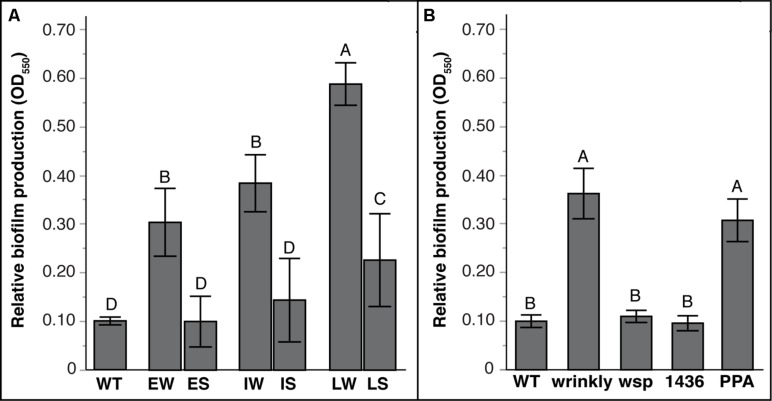
FIGURE 4.
Biofilm production varies with duration of biofilm adaptation and by mutation class. Mean biofilm production with 95% CI shown. Tukey post hoc tests were used for pairwise comparisons, with unique letters reflecting significant differences. (A) Mean biofilm production by selective history of ancestors: Early Wrinkly (EW), Early Smooth (ES), Intermediate Wrinkly (IW), Intermediate Smooth (IS), Late Wrinkly (LW), Late Smooth (LS). (B) Biofilm production by mutation class: wild-type (WT), two-component transcriptional regulator (1436), wsp operon, and putative PPA genes.

