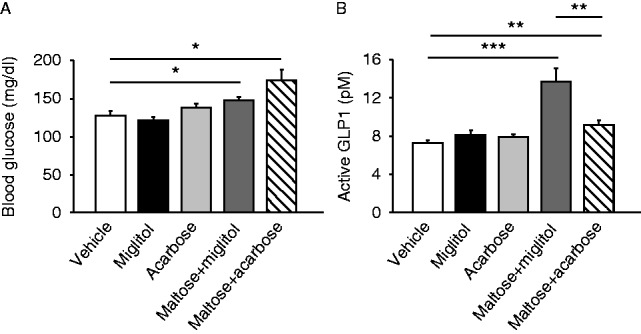
Figure 3.

Comparison between miglitol and acarbose of GLP1 secretion induced by maltose. Blood glucose (A) and plasma GLP1 concentrations (B) in the portal vein at 30 min after oral administration of miglitol, acarbose, maltose plus miglitol, or maltose plus acarbose are shown. Data are expressed as mean±s.e.m. *P<0.05, **P<0.01 and ***P<0.001.

 This work is licensed under a