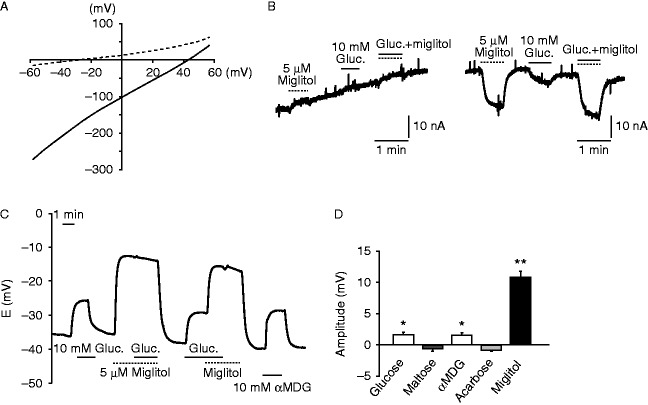
Figure 4.
Electrophysiological recording of Xenopus laevis oocytes expressing hSGLT3. (A, B, C, and D) (A) I–V relationship of the oocytes expressing hSGLT3 in the presence (solid line) or absence (dashed line) of miglitol. (B) A representative recording of whole-cell current under voltage clamp mode in an oocyte expressing hSGLT3 in the absence (left) or presence (right) of Na+ in the buffer. ‘Gluc.’ denotes glucose. (C) A representative recording of the membrane potentials under current clamp mode in an oocyte expressing hSGLT3 in response to glucose and/or miglitol. The SGLT3 agonist α-methyl-d-glucopyranoside (αMDG) was used as a positive control for SGLT3-dependent depolarization. ‘Gluc.’ denotes glucose. (E) The current changes by several stimuli (n=4 for each). Data are expressed as mean±s.e.m. *P<0.05 and **P<0.01 (compared with the base line).

 This work is licensed under a