
FIG 3 .
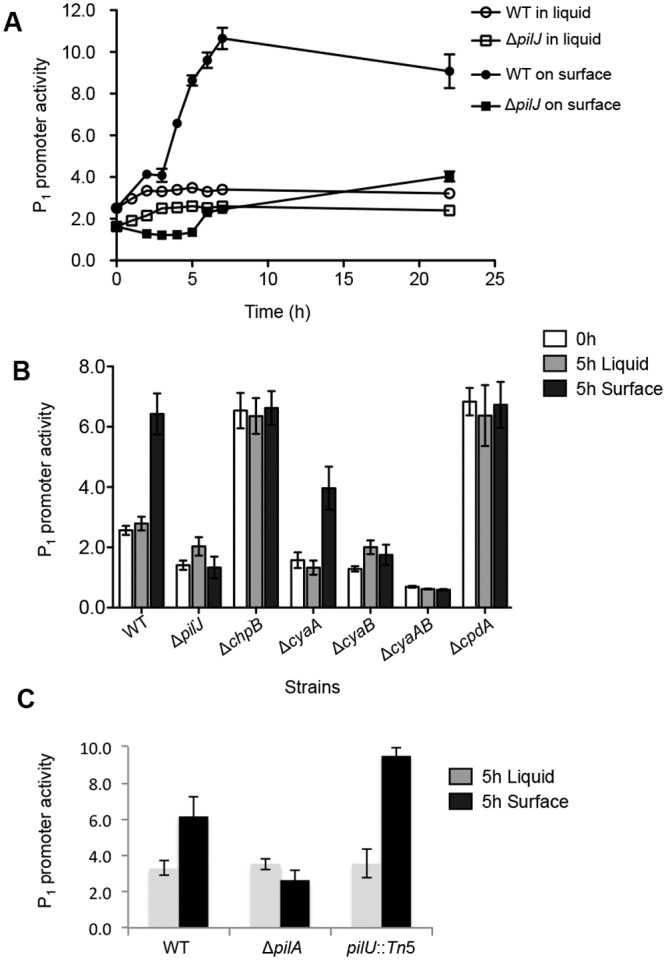
The cellular cAMP levels in cells grown in liquid broth and on agar surface. (A) Representative time lapse plot of cAMP levels in cells grown in liquid broth or on an agar surface with the same base medium (M8). The cellular cAMP level is expressed as P1-lacZ activity divided by the vector control. The means ± SEM from three biological replicates were shown. (B) cAMP levels in the WT and mutant strains grown in M8 liquid broth or on agar surface. Each strain was grown to early log phase in M8 broth. At time = 0 h, the cultures were split and either continued to be incubated in M8 broth or spread on M8 plate (1% agar) for an additional 5 h. The data represent a minimum of three independent experiments with two biological replicates each, and values are reported as means ± SEM. (C) cAMP levels in the WT and mutant strains grown in M8 liquid broth or on agar surface, performed as outlined in panel B.