
Figure 10.
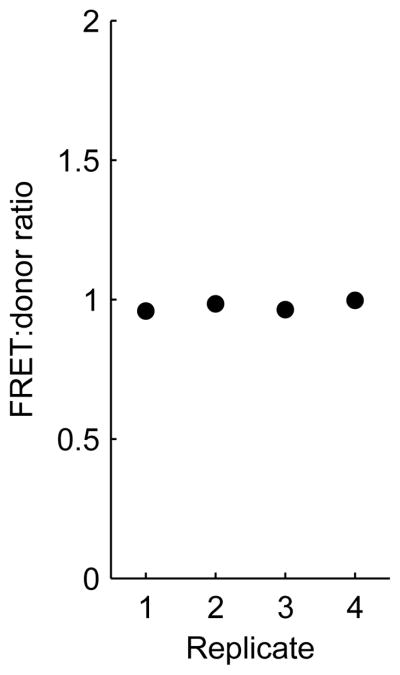
Checking for consistency in bleedthrough coefficient measurements. Donor-only transfected wells, which are used to calculate donor bleedthrough coefficients, were imaged, and the FRET:donor ratio (equivalent to the donor bleedthrough coefficient in the case of donor-only control wells) was plotted versus replicate number. There is very little variance across the replicates.