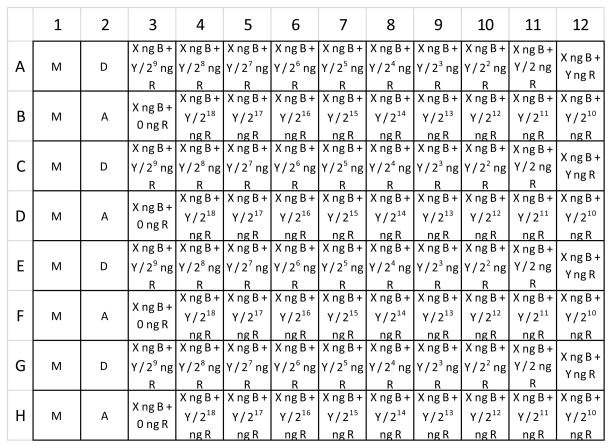
Figure 3.
Layout of cell transfections in black-walled, flat-bottom imaging 96-well microplate. Column 1 contains 8 replicates of mock transfected cells. Column 2 contains four replicate wells each of cells transfected with a donor-only or acceptor-only control. The remainder of the columns contain cells transfected with biosensor plus varying amounts of regulator. Regulator amount halves serially from right to left across row A, and then again across row B, to cover a dosage range of greater than 200,000 fold. Subsequent rows contain replicates of rows A and B, for a total of four replicate wells for each biosensor/regulator combination. M = mock. D = donor only. A = Acceptor only. X = 4.26. B = biosensor. Y = 42.56. R = regulator.

