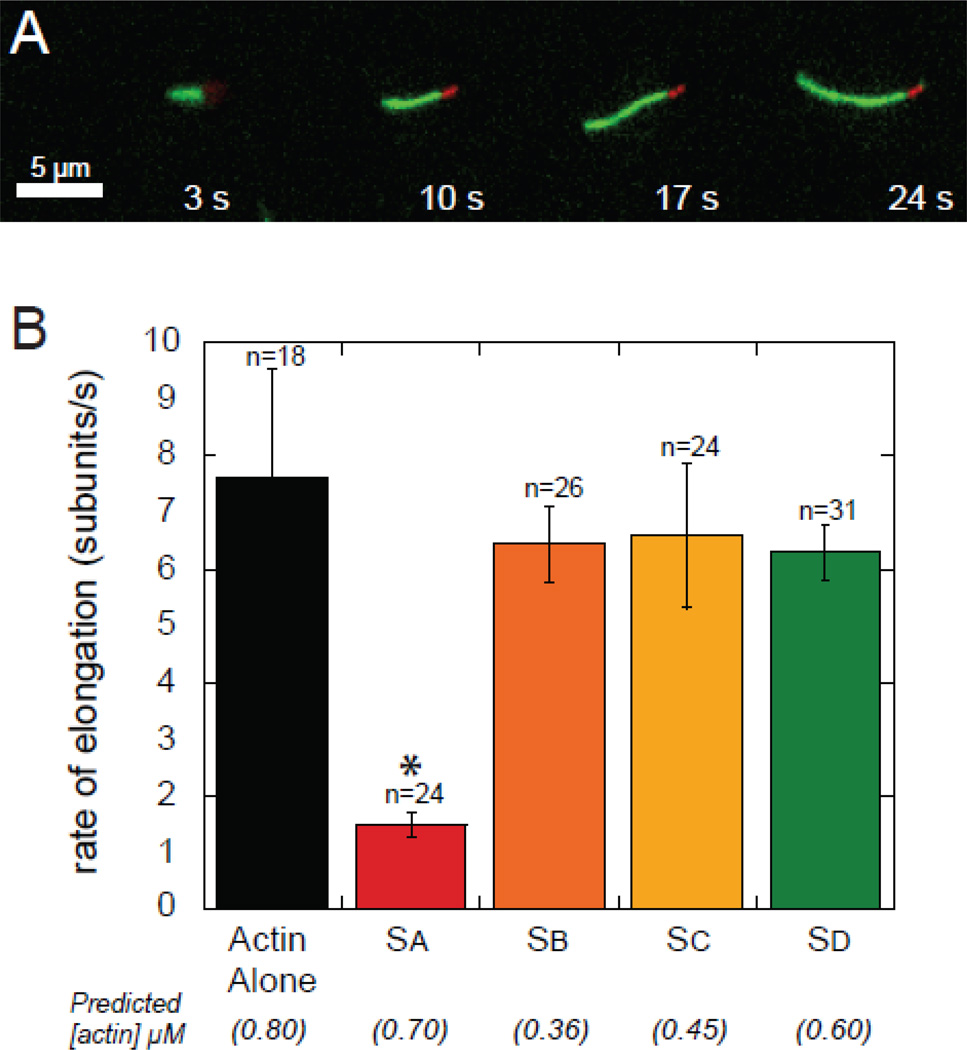
Figure 6.
Elongation rates of actin determined by TIRF microscopy. (A) Example of seeded actin (red) and elongation (green) in the presence of Sc observed by TIRF. (B) Actin elongation rates in the presence of 1 µM of the indicated WH2 domains. The values in parentheses are the predicted concentrations of free actin, given the Kds determined in this study. Asterisk indicates statistical significance (p < 0.01) when compared with actin alone (n is the number of filaments analyzed for each case; error bars are one standard deviation).

