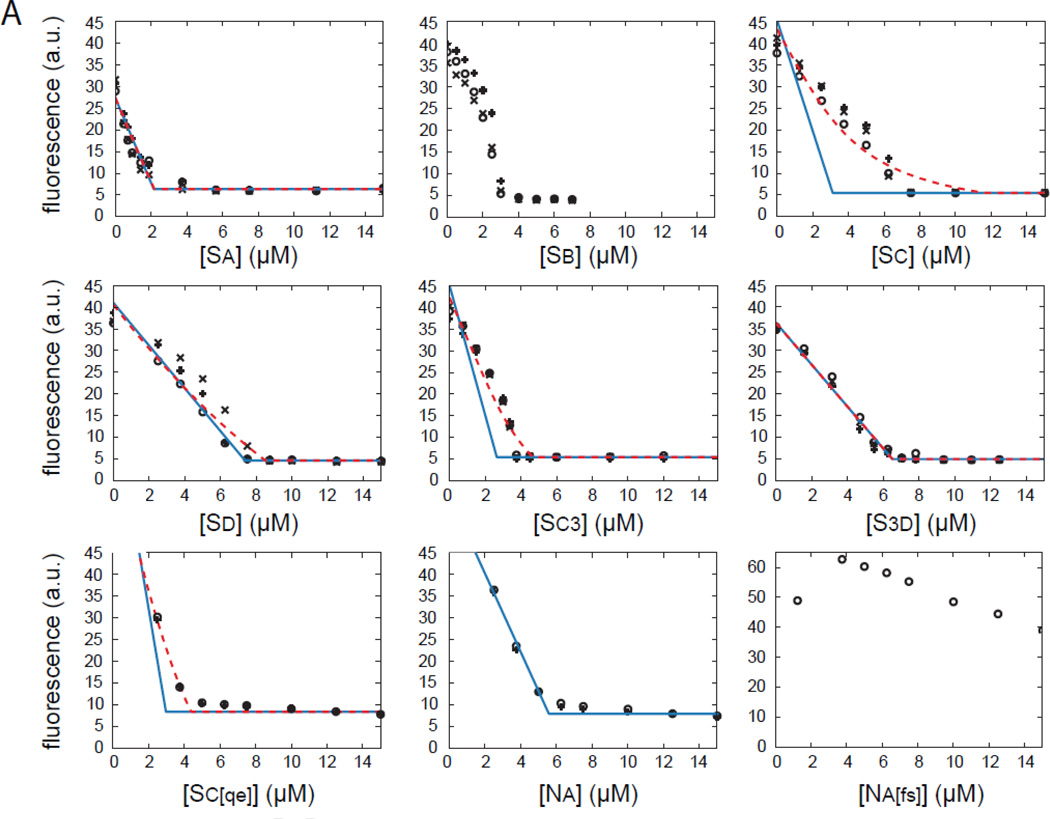
Figure 7.
Effect of individual WH2 domains on actin at steady state. Raw data (black symbols) and analysis (blue and red traces) of steady state polymerization titration (SSPT) assays for all nine constructs are shown. Each concentration was tested three times, represented by different symbols. Predicted values based on the model described in the appendix, with Kd fixed by our anisotropy measurements, are shown in blue. Extending this model to include filament binding (Kdf) is shown in red. Due to extremely weak binding, we could not analyze the Na[fs] curves. Sb was not analyzed because it did not reached steady state, as evidenced by the concavity of the titration curves. No red trace is shown for Na because the regression did not converge.

