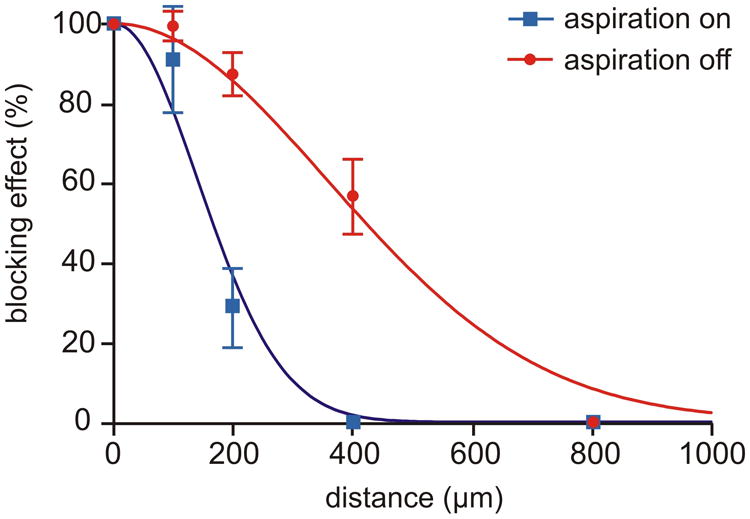
Figure 3.

Spatial drug delivery profile of the MFP, with and without the feature of hydrodynamically confined fluid (HCF). CNQX (5 μM) was applied via the MFP to brain slices at different distances from the recording site, using 100 μm steps (compare Fig. 1B). The MFP was alternated between two modes: with (suction on, blue curve) and without (suction off, red curve) hydrodynamically confined microflow. Data are shown as mean ± S.E.M for 5 experiments, each of which provided both “on” and “off” measurements. The fitted Gaussian curves, as defined by y=100 exp(-(x/SD)2/2), illustrate that HCF leads to a more narrow drug delivery profile, curve-SD being 141 vs. 357 μM, p<0.001.
