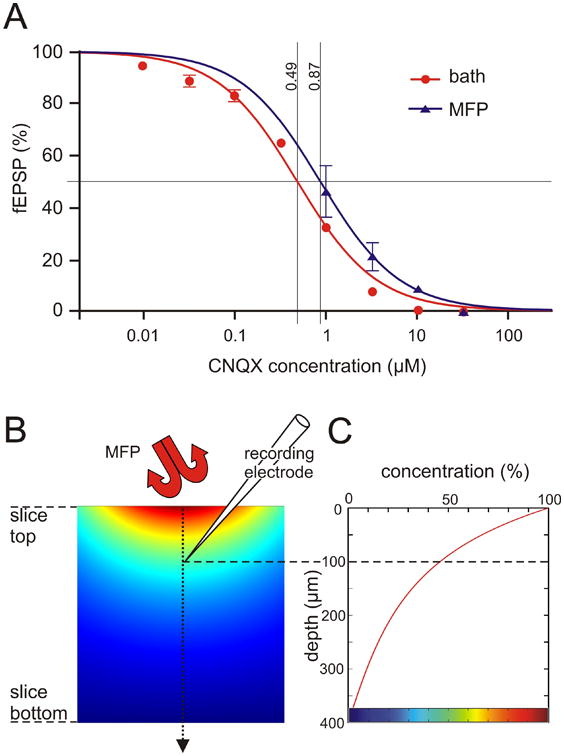
Figure 4.

Concentration response curves for bath perfusion and MFP (A) and comparison with a diffusion model (B, C). In Figure A, each data point was the percentage of fEPSP slope after application of a certain concentration of CNQX compared with the value under drug-free buffer, testing concentrations from 10 nM to about 30 μM in equal logarithmic steps (data from 8 bath and 4 MFP experiments, shown as mean ± S.E.M.). Curve fitting used a reverse Hill equation with slope constrained to 1, y=100/(1+(c/IC50)), appearing sigmoid when plotted semilogarithmically as a function of log10(c). It can be seen that the drug delivery efficiency of the MFP was slightly smaller than that of bath perfusion, with corresponding IC50 values of 0.49 μM and 0.87 μM (p<0.01), implying a relative efficiency of 56%. B. Cross section of brain slice diffusion model with a Gaussian-shaped concentration profile on top, using the fitted “HCF on curve” in Figure 3 as template, and surrounded elsewhere by zero concentration. The simulated steady state concentration of CNQX is visualized by pseudocolors. C. Plotting the calculated concentration along the center line, from top to bottom of the slice, reveals that at an estimated recording depth of 100 um, the drug concentration is about 46% of the one applied. Colorbar at bottom of C refers to pseudocolors in B.
