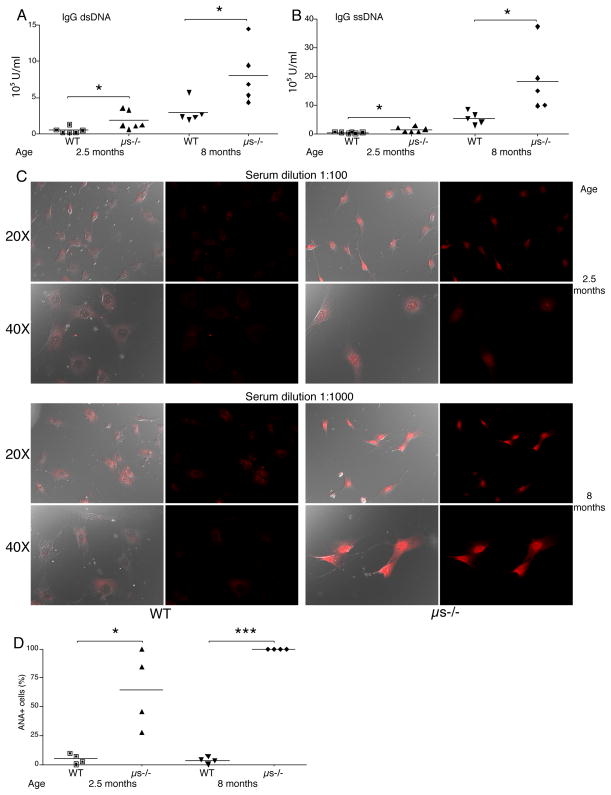
Figure 1. Strong production of anti-DNA and ANA serum autoantibodies in μs−/− mice.
(A and B) Shown are relative units (A) anti-dsDNA IgG and (B) anti-ssDNA IgG in WT and μs−/− mice at indicated ages as measured by ELISA. Each symbol represents values for a single mouse, horizontal bars indicate mean for the group (n=5 – 6/group). (C) Detection of antinuclear antibodies (ANA) via fluorescent staining of mouse 3T3 cells with serum from young and aged WT and μs−/− mice. Representative images are shown. Left panels shows the overlay images with DIC outlining the cells and fluorescent red staining for IgG, right panels shows images with fluorescent red staining for IgG only. White bars indicate 25-μm scale bars. (D) Shown are frequencies of cells stained with diluted sera as indicated, calculated from counting total cells and stained nuclei from randomly chosen images (n=20–100 cells per slide). Data are representative of three (A, B) or two (C, D) independent experiments. Group-wise comparisons were conducted using Student’s t test: *p<0.05, **p<0.005, ***p<0.0005.

