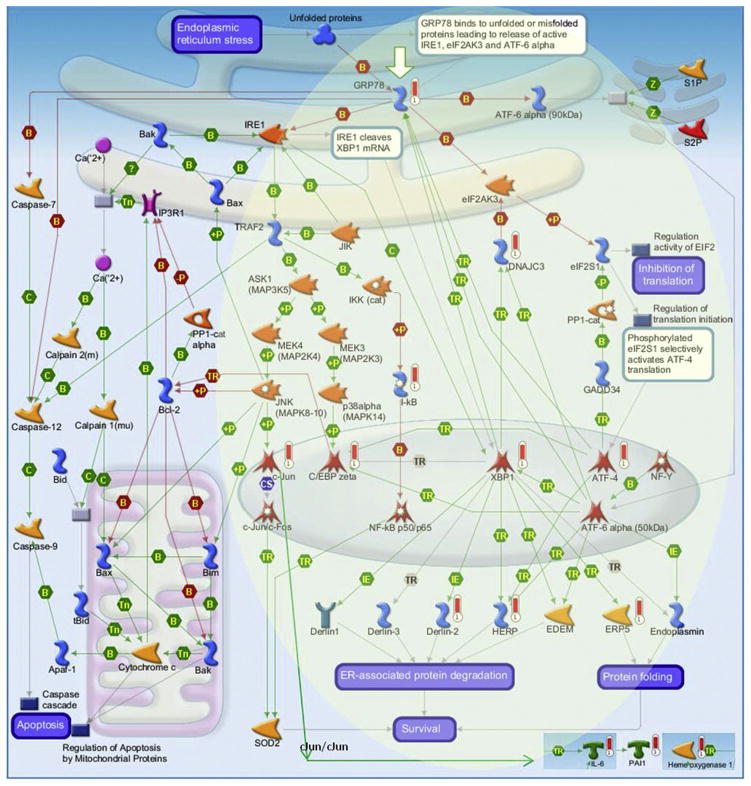
Figure 2.
Differentially expressed gene enrichment of the top scored pathway maps. The most significant signaling pathway map for Apoptosis and survival-Endoplasmic reticulum stress response pathway was additionally enriched with differentially expressed genes from the Immune response-IL-1 signaling pathway. Enrichment and pathway analyses were conducted using the MetaCore pathway/network analysis (14). Experimental data were linked to and visualized on the maps as thermometer-like figures. Upward thermometers have red color and indicate upregulated signals. For additional figure legend go to http://lsresearch.thomsonreuters.com/static/uploads/files/2014-05/MetaCoreQuickReferenceGuide.pdf.

