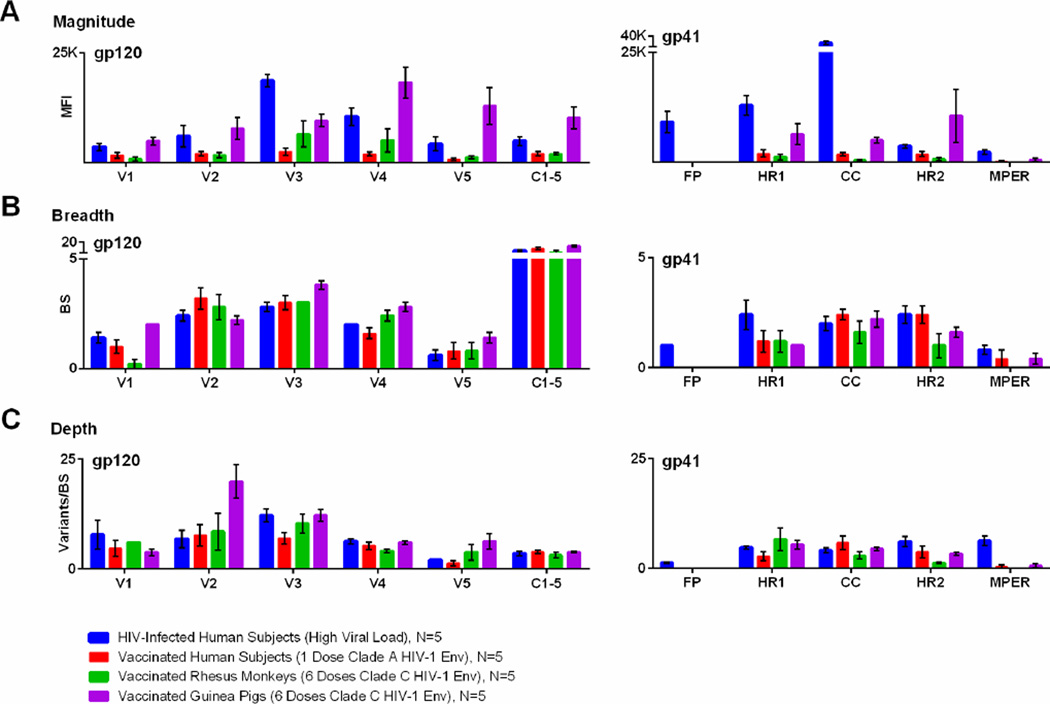
Figure 6. Magnitude, breadth, and depth of HIV-1-specific antibody binding, as measured by global HIV-1 peptide microarray.
Antibody responses for four groups are are plotted by gp120 and gp41 region, including (A) the mean fluorescent intensity of positive peptides (magnitude), (B) the number of binding sites (breadth), and (C) the mean number of epitope variants at each binding site (depth). The four groups include HIV-1-infected subjects (blue), vaccinated human subjects (red), vaccinated rhesus monkeys (green), and vaccinated guinea pigs (purple). Bars represent SEM.

