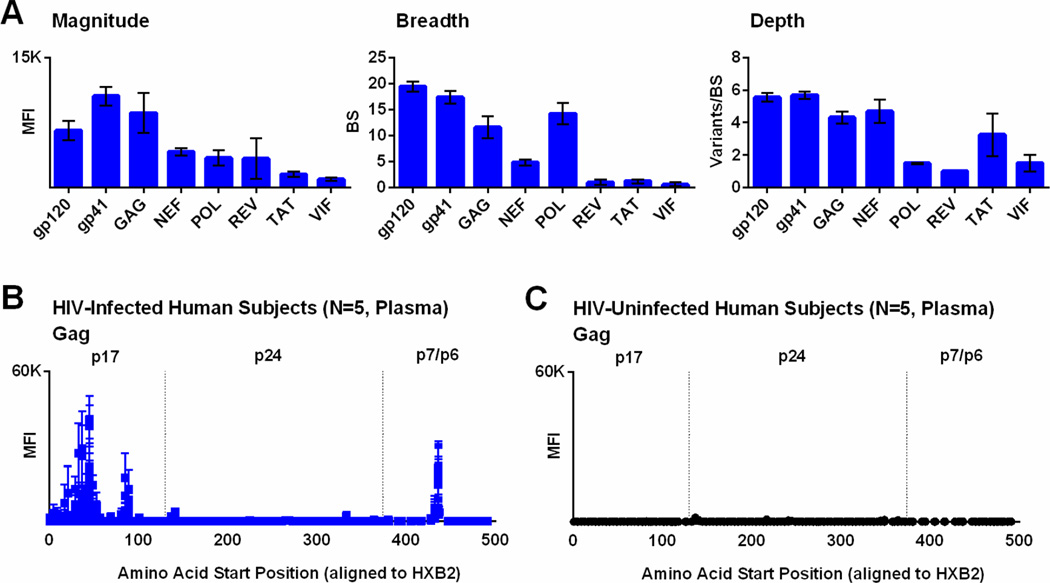
Figure 8. IgG binding to linear HIV-1 peptides from across the HIV-1 proteome in HIV-1-infected subjects.
(A) The mean fluorescent intensity (MFI) of positive HIV-1 peptides (magnitude), number of binding sites (breadth), and mean variants per binding site (depth) are shown for multiple HIV-1 proteins for 5 HIV-1-infected human subjects. Bars represent SEM. In addition, the MFI of positive HIV-1 Gag peptides are plotted against the amino acid start position as aligned to HXB2 HIV-1 reference strain for 5 HIV-1-infected human subjects (B) and 5 HIV-uninfected controls (C). Bars represent SEM.

