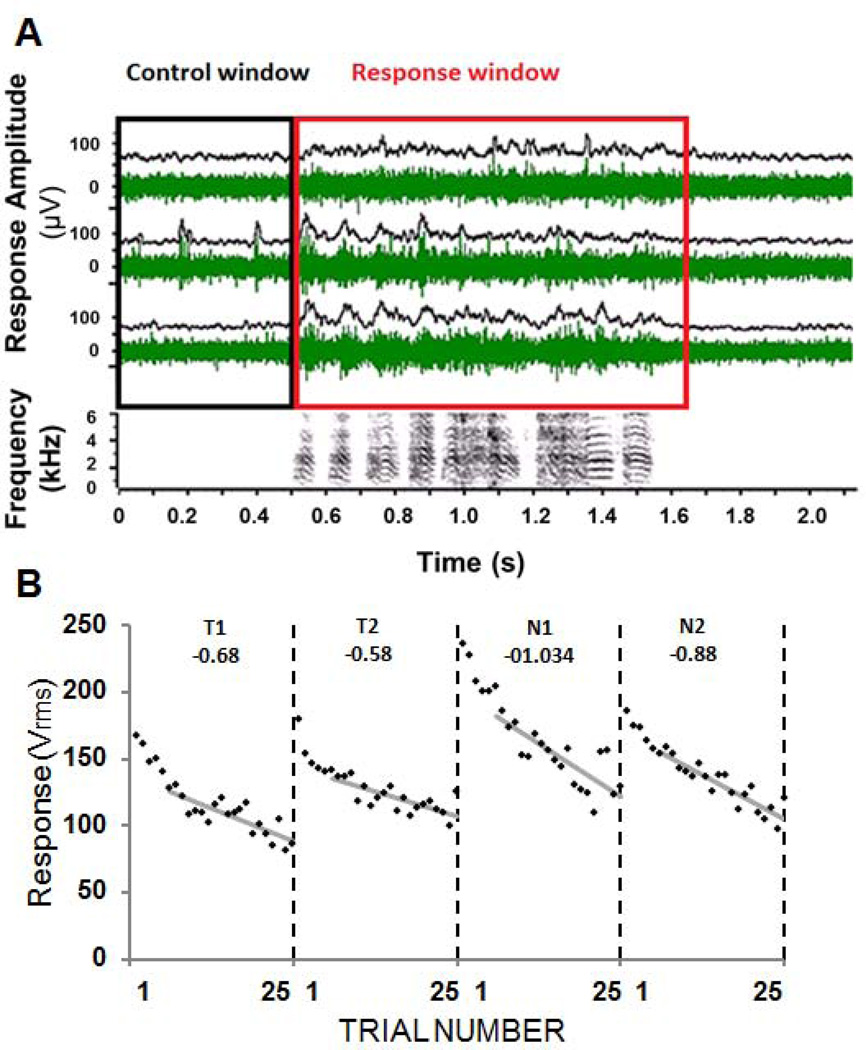
Figure 2.
A) Representative responses at 3 recording sites in NCM. Raw multi-unit records (green and black traces) are shown for a single trial. To calculate the response amplitude at a given site, the response during the Control (C) window (black box; 500ms of silence prior to stimulus onset) was subtracted from the response during the Response (R) window (red box; stimulus presentation + 100ms of silence). R-C was calculated for each trial of each stimulus for each recording site. B) The response magnitude of multiunit activity recorded at one site in NCM during presentation of four songs that were previously heard during training (T1, T2) or were novel (N1, N2). Songs were played 25 times each in shuffled order, but responses have been reordered for clarity. Adaptation rates were calculated for trials 6–25 (gray lines) and are shown at the top of each panel.

