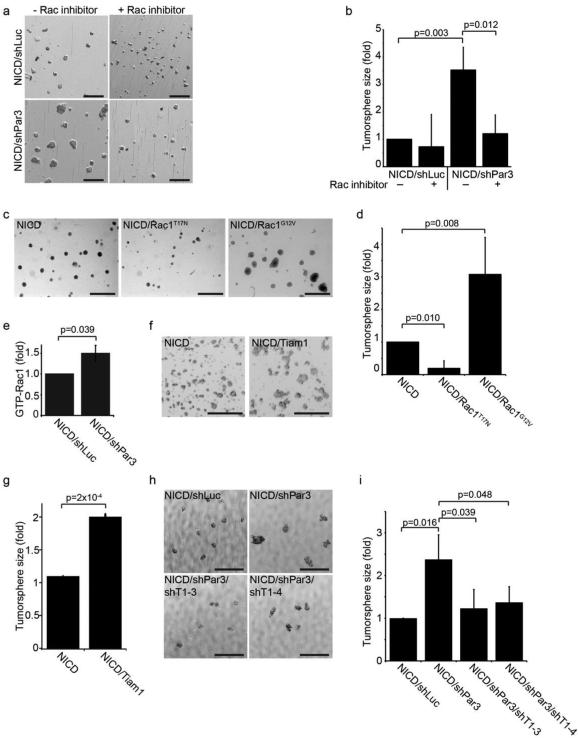
Figure 2. Loss of Par3 promotes tumorsphere growth through Rac1 activation by Tiam1.
(a) Tumorsphere cultures of MECs expressing NICD/shLuc or NICD/shPar3 in the presence or absence of 25 μM Rac1 inhibitor (NSC23766, Tocris). (b) Quantification of tumorspheres sizes from (a). (c) Tumorsphere cultures of MECs expressing NICD, NICD/Rac1T17N (dominant negative), or NICD/Rac1G12V (constitutively active). (d) Quantification of tumorsphere sizes from (c). (e) Levels of total active Rac1-GTP were measured in NICD/shLuc and NICD/shPar3 tumorspheres using a GLISA assay kit (Cat. # BK128, Cytoskeleton Inc.), n=5. (f) Tumorsphere cultures of MECs expressing NICD or NICD/Tiam1. (g) Quantification of tumorsphere sizes from (f). (h) Tumorspheres of MECs expressing NICD/shLuc or NICD/shPar3 and one of two Tiam1 shRNA (shRNA sequences: shTiam1-3 5’-cgatgactttatatttata; shTiam1-4 5’-tttcgtgctatgatgaatc). (i) Quantification of tumorsphere sizes in (h), n=4. n=3 independent samples, unless otherwise noted. p-values were calculated using the ANOVA with Tukey HSD post-hoc test (b, d, i) or the student’s t-test (e, g). Error bars represent sd. Scale bars=1mm.

