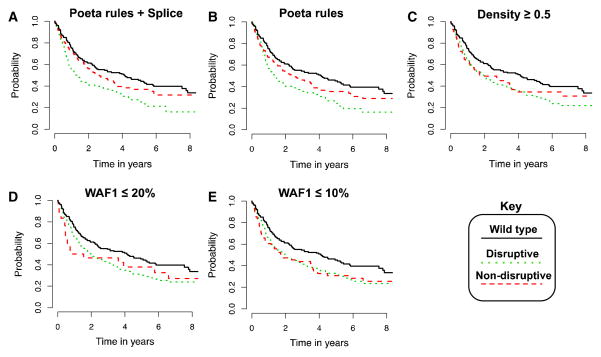
Fig. 2.
Kaplan-Meier survival curves for top-predicting classifiers of HNSCC progression-free survival. Survival curves for all classifiers that predicted a causative effect for disruptive mutations (i.e., hazard ratio >1.0) from Table 2. Progression-free survival among HNSCC patients with wild-type TP53 shown for comparison

