
Figure 1.
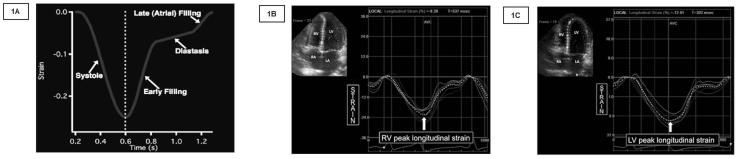
(1A) The standard strain curve is depicted with the Strain (%) on the y axis and time (s) on the x-axis. (1B) Strain imaging of the right ventricle in a premature infant using STE. (1C) LV strain imaging graph in a premature infant using STE. Segmental strain is represented by six different curves and the average longitudinal strain by the white dotted curve. The peak of the dotted curve was considered the peak longitudinal strain value. RV: Right ventricle. LV: Left Ventricle STE: Speckle tracking echocardiography.