Figure 3.

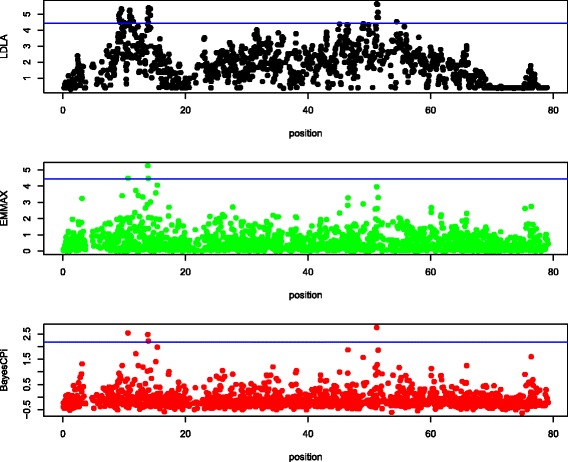
Manhattan plot of chromosome 12 in sheep. The y-axis is log10(1/P value) for LDLA and EMMA and log10(Bayes Factor) for BayesC; the x-axis is the position along the chromosome in cM; the blue line (if any) is the rejection threshold.

Manhattan plot of chromosome 12 in sheep. The y-axis is log10(1/P value) for LDLA and EMMA and log10(Bayes Factor) for BayesC; the x-axis is the position along the chromosome in cM; the blue line (if any) is the rejection threshold.