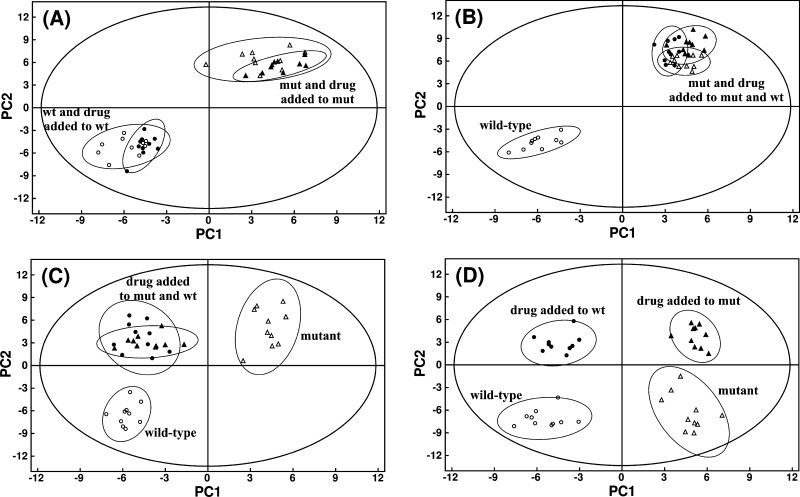
Figure 4.
Illustration of hypothetical PCA scores plot for the following scenarios (A) inactive compound, (B) active and selective inhibitor, (C) active, nonselective inhibition of target and secondary protein, and (D) active, nonselective preferential inhibition of secondary protein. Labels correspond to: wild-type cells (open circles), drug-treated wild-type cells (black solid circles), knockout mutant cells where the protein target of the drug is inactive (open triangles), and drug-treated mutant cells (black solid triangles). Abbreviations correspond to mutant cells (mut) and wild-type cells (wt). Adapted from Forgue et al. (2006).95

