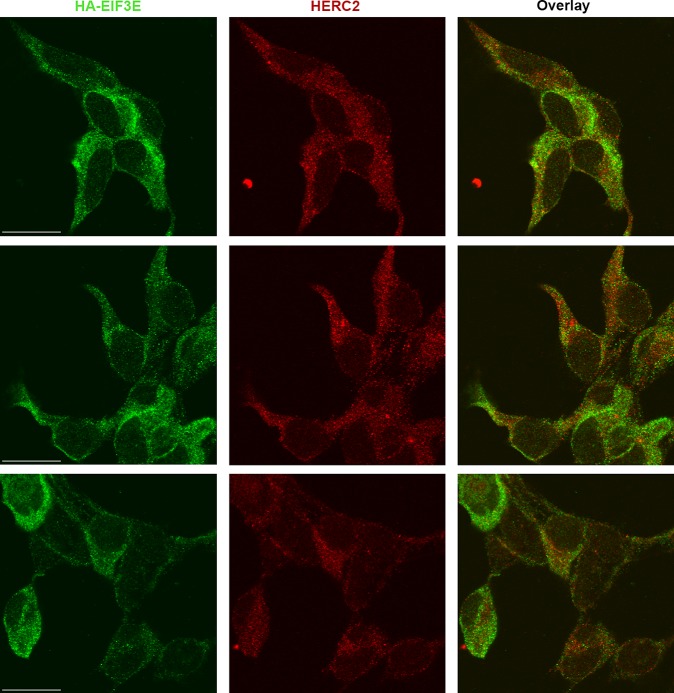
Figure 5.
Colocalization of HERC2 and EIF3E. 293 T-REx cells stably expressing inducible N-HA EIF3E were probed for HA to visualize EIF3E (green), followed by probing for HERC2 (red). Overlay of HA and HERC2 shows colocalization of EIF3E and HERC2 primarily in the cytoplasm. Similar colocalization and staining patterns were seen regardless of the order of staining for HA and HERC2, or the fluorophore for each secondary antibody. Scale bar in the EIF3E panels, 20 μM.

