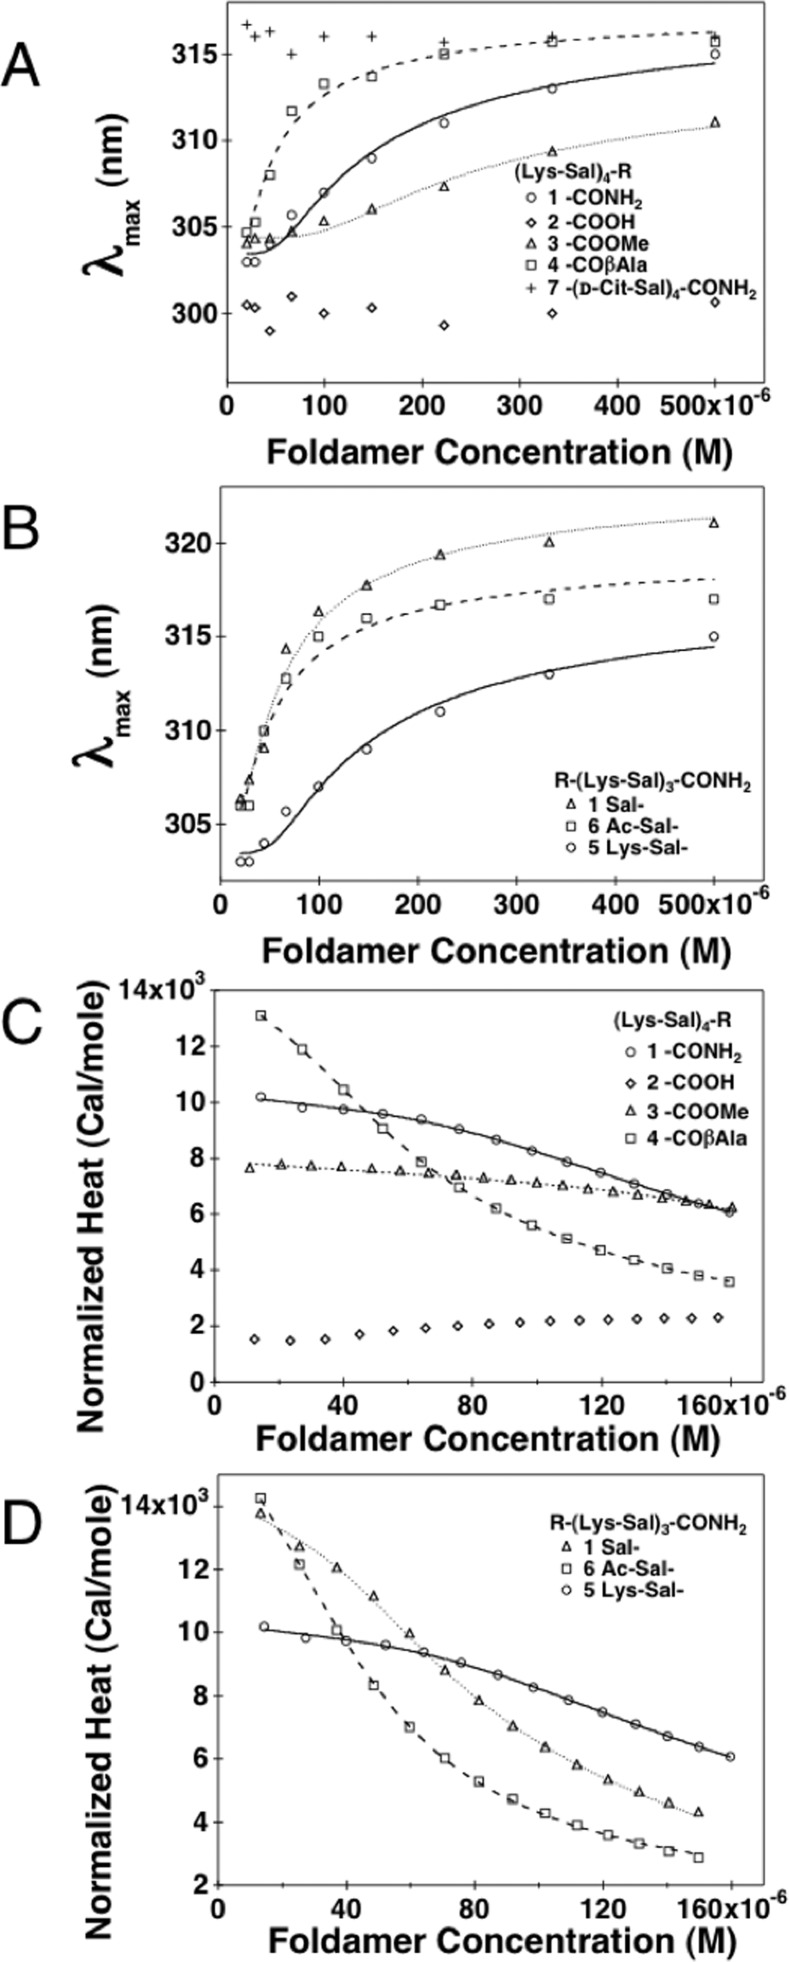
Figure 4.
UV–vis absorption λmax and normalized ITC heats of dilution as a function of SalAA foldamer concentration. (A) UV–vis absorption λmax as a function of SalAA foldamer concentration for C-terminal modifications. (B) UV–vis absorption λmax as a function of SalAA foldamer concentration for N-terminal modifications. Normalized ITC heats of dilution (pK(hex-mon)) values are summarized in Table 2 as a function of SalAA foldamer concentration for C-terminal (C) and N-terminal (D) modified series, and their respective fits are illustrated as lines.

