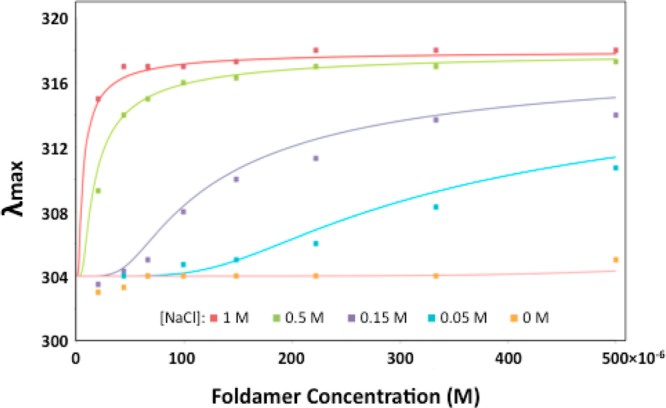
Figure 5.

Concentration-dependent shifts in λmax for 1 at varying [NaCl] in 0.05 M Tris, pH 7.4. The smooth curves were generated by global fitting of the data to a monomer-hexamer equilibrium. The value of λmax for the monomer (304 nm) and hexamer (318 nm) were globally fit, while the value of pK(hex-mon) was allowed to vary for each curve. The fit pK(hex-mon) values were <15 at 0 M NaCl, 17.4 at 0.05 M, 19.7 at 0.15 M, 24.1 at 0.5 M, and 26.5 at 1.0 M.
