Figure 1.

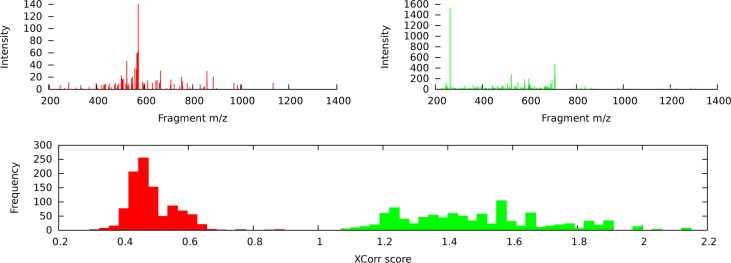
Calibrated vs raw PSM scores. Two spectra, σ14 (red) and σ716 (green), and the corresponding histograms of XCorr scores generated by searching each spectrum against 1000 randomly drawn decoys. The spectra are taken from the yeast data set.

Calibrated vs raw PSM scores. Two spectra, σ14 (red) and σ716 (green), and the corresponding histograms of XCorr scores generated by searching each spectrum against 1000 randomly drawn decoys. The spectra are taken from the yeast data set.