
Figure 10.
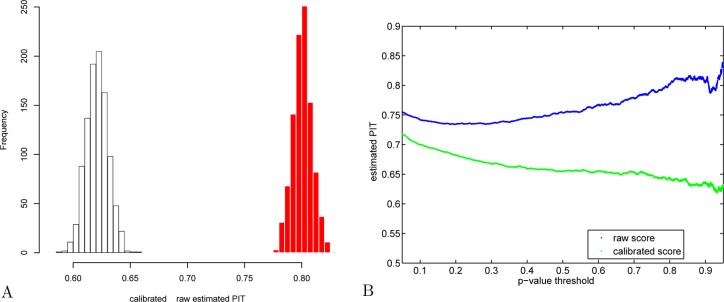
Estimating Käll’s percentage of incorrect targets: calibrated versus raw scores. (A) The value of π0 in the yeast charge 2 optimal target PSM set was estimated separately using each of 1000 decoy sets. The red histogram corresponds to raw XCorr scores, and the white, to calibrated scores. (B) Using the first decoy set, π0 was estimated using a fixed p-value threshold (again, yeast charge 2 set). The increasing trend that troubled Käll et al.21 (Figure 6B in their paper) is visible in blue here when using the raw score, but it disappears when the estimate is based on calibrated score (green).