Fig. 6.

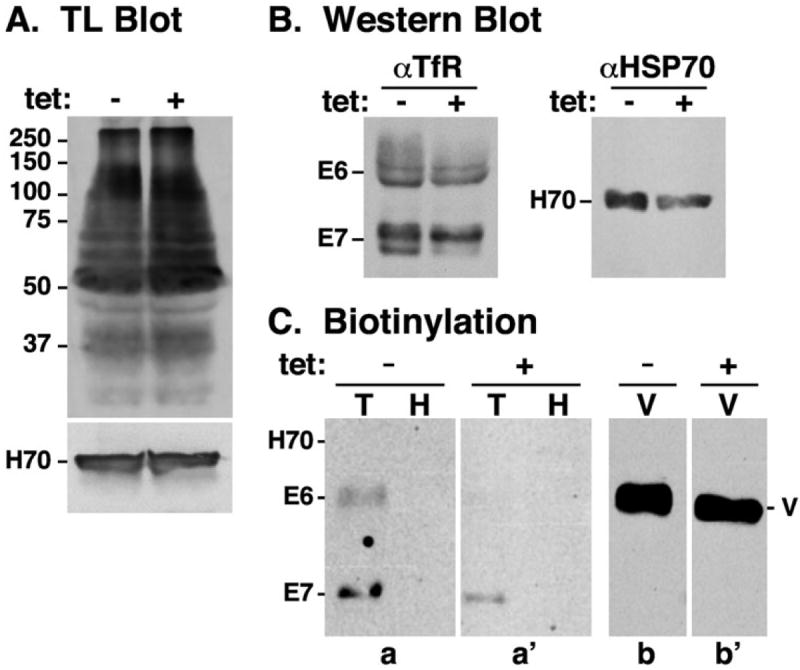
Downregulation of cell surface transferrin receptor. pNAL modification and TfR distribution was investigated in control (tet−) and TbRab7 silenced (tet+) cells.
A. Total extracts of control and silenced TbRab7 RNAi cells were fractionated by SDS-PAGE (107 cells/lane) and transferred to membranes. Membranes were blotted first with anti-HSP70 as a loading control, stripped and then blotted with TL. Molecular weight markers are indicated in kDa.
B. Total cell extracts (107 cells/lane) were immunoblotted with anti-TfR antibody. Blot was stripped and reprobed with anti-HSP70 as a loading control.
C. Intact control and silenced TbRab7 RNAi cells were surface biotinylated as described in Experimental procedures. Polypeptides were immunoprecipitated with anti-TfR (T), anti-HSP70 (H, control negative), and anti-VSG221 (V, control positive). After fractionation by SDS-PAGE (TfR & HSP70, 107 cell equivalents/lane; VSG221, 5 × 10⁴ cell equivalents/lane), and membrane transfer, blotting was performed with SA:HRP. All lanes are from the same gel, blot and film, but have been reordered for the purpose of presentation. Sections a & a’, and b & b’, were digitally contrasted identically before rearrangement. (A–C) Mobilities of the ESAG6 (E6) and ESAG7 (E7) subunits of TfR, HSP70 (H70) and VSG (V) are indicated.
