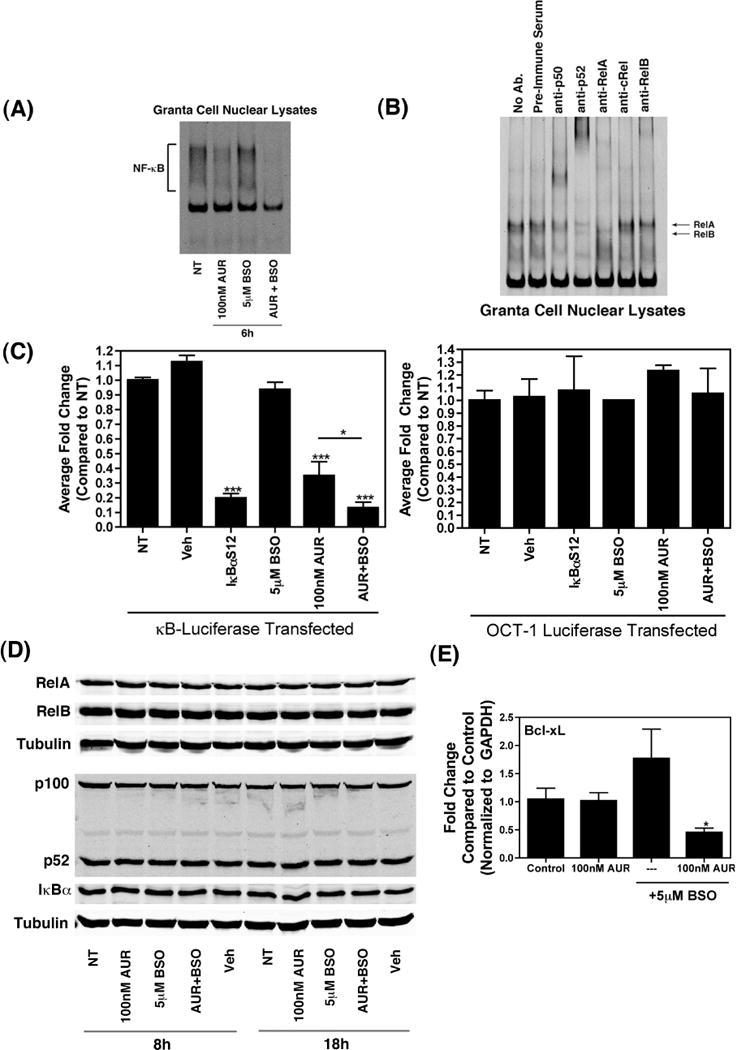
Figure 3. Effect of Auranofin and BSO on NF-κB activity.

(A) Granta cells (1×10⁶) were treated with the indicated concentrations of Auranofin and BSO, either alone or together, for 6 h. Following these treatments, nuclear extracts were prepared and EMSA was performed by incubating nuclear extracts with IR-Dye-700 conjugated, double-stranded DNA probe at room temperature for 10 minutes, followed by resolution of the protein-DNA complexes on native 4 % polyacrylamide gels. The bands were then visualized on an Odyssey infrared imager (LI-COR Biosciences). (B) Nuclear extracts were prepared from untreated Granta cells and super-shift assays were performed by incubating nuclear extracts with IR-Dye-700 conjugated, double-stranded DNA probe at room temperature for 10 minutes, followed by incubation with the indicated antibodies for 5 minutes. The protein-DNA-antibody complexes were resolved on native 4 % polyacrylamide gels. The bands were then visualized as described above. (C) Luciferase reporter plasmids containing NF-κB or OCT-1 responsive elements upstream of a firefly luciferase gene was transfected into Granta cells (5×10⁶), together with either a vector expressing IκBαS1/2 or an empty vector, using Nucleofector (Amaxa/Lonza). The total amount of plasmid DNA was kept constant at 5 μg for each transfection. Thirty minutes after the transfection, cells were plated into single wells and were either left untreated or incubated for 6 h with the indicated doses of Auranofin or BSO, alone or together. Treatment with DMSO (Veh) was used as a control. Cell lysates were prepared using reporter lysis buffer and luciferase activity was measured with a SpectraMax M3 plate reader (Molecular Devices). Data are presented as fold change compared to non-treated cells and are shown as mean ± SEM of values derived from three replicates from each of four combined experiments for NF-κB or from two combined experiments for OCT-1. ***, p<0.001, **, p<0.01 as compared to cells transfected with the luciferase reporter and left untreated. (D) Whole cell lysates from Granta cells treated as indicated were subjected to immunoblot analysis with antibodies against RelA (first panel), RelB (second panel), p100/p52 (fourth panel), IκBα (fifth panel), or α-Tubulin (third and sixth panels). (E) Bcl-xL mRNA levels were determined via qRT-PCR in Granta cells treated as indicated for 24 h. mRNA levels were compared using the ΔΔCt method. *, p<0.05 as compared to DMSO-treated cells (control).
