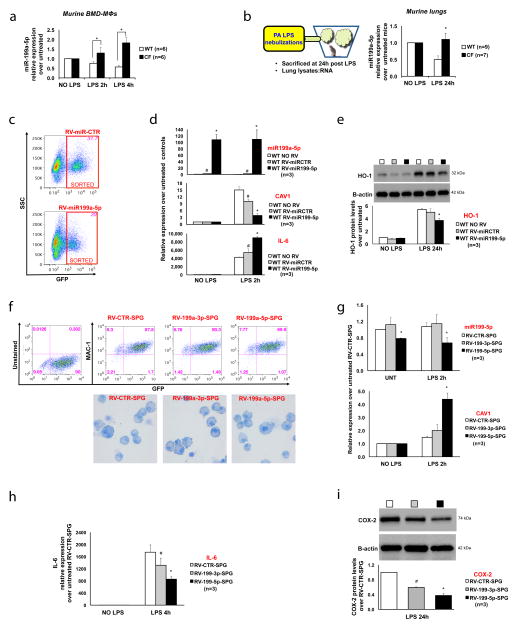
Figure 1. miR-199a-5p, an upstream regulator of CAV1 and TLR4 signaling, is increased in CF.
(A) MiR-199a-5p relative expression (qPCR) in murine WT (white bars) and CF (black bars) BM-derived MΦs, untreated or treated with LPS; (B) Cartoon representation of the in vivo treatment and qPCR for miR-199a-5p in lung lysates from WT and CF-KO mice untreated or treated with LPS; (C) Flow cytometry dot-plots of WT murine MΦs infected with RV-miR-GFP (miR-CTR) vector control (top) or RV-miR-199a-5p-GFP (bottom), showing FACS sorting scheme; (D) qPCR for miR-199a-5p (top), CAV1 (middle) and IL-6 (bottom) in RVs infected and sorted WT MΦs, untreated or treated with LPS; data are compared to uninfected WT MΦs; (E) WB and densitometric analysis for HO-1 in uninfected or RVs infected WT MΦs, untreated or treated with LPS; (F) Flow cytometry dot-plots of CF murine MΦs infected with RV-sponge (SPG)-control, RV-199a-3p-SPG or RV-199a-5p-SPG, showing puromycin-selected-GFP positive population expressing the MΦs marker MAC-1 (top panel) and MΦs cytospun cells stained with Giemsa, demonstrating absence of morphological abnormalities among different MΦ populations (bottom panel); qPCR for miR-199a-5p and for CAV1 (G) and IL-6 (H) in RV-SPG infected and puromycin-selected CF MΦs, untreated or treated with LPS; (I) WB and densitometric analysis for COX-2 in RV-SPG infected and puromycin-selected CF MΦs, untreated or treated with LPS. For qPCR, miR-199a levels are normalized to RNU6B and CAV1/IL-6 expression to S18. For WB, protein fold increase is normalized to B-actin. Unless indicated differently, for each experiment the data are the result of three experimental biological repeats or are representative of three experimental biological repeats. Statistical analyses were conducted using one-sided two-sample t-tests. Error bars indicate standard deviation. Symbols * and # indicate a statistically significant difference among the experimental group and control group with a P value <0.05.

