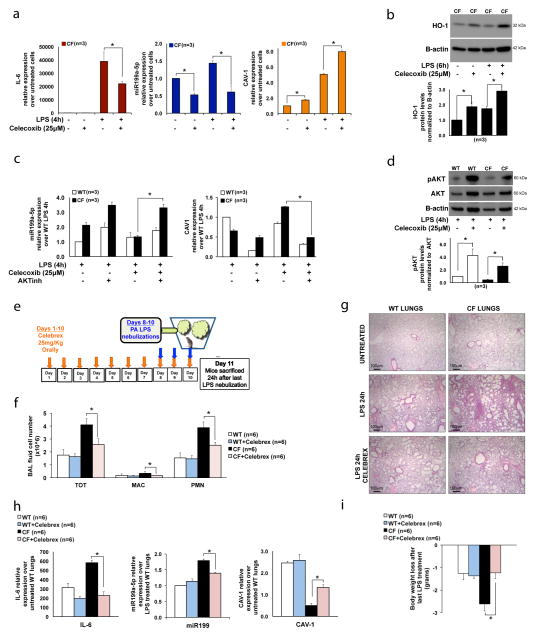
Figure 3. Celecoxib rescues the miR-199a-5p/CAV1 pathways by stimulating PI3K-AKT signaling in CF MΦs, and decreases the lung hyper-inflammatory response to LPS in CF-affected mice.
(A) qPCR for IL-6 (left), miR-199a-5p (middle) and CAV1(right) and (B) WB and densitometric analysis for HO-1 in CF murine MΦs untreated or treated with LPS, in absence or presence of celecoxib; (C) qPCR for miR-199a-5p (left) and CAV1 (right) in WT and CF murine MΦs treated with LPS, in presence or absence of celecoxib and of PI3K-AKT inhibitor LY94002; (D) WB and densitometric analysis for AKT, pAKT and B-actin in WT and CF murine MΦs treated with LPS for 4h in presence or absence of celecoxib; (E) In vivo experiment schematic representation; total and differential BAL fluid cell number (F), hematoxylin/eosin staining in paraffin embedded lung tissues (G), qPCR for IL-6, miR-199a-5p and CAV1 (H) and body weigh loss (I) from WT and CF mice treated chronically (10 days) with celecoxib (Celebrex) and then challenged with LPS for three days. Mice were sacrificed 24h after last nebulization. For qPCR, miR-199a levels are normalized to RNU6B and CAV1 and IL-6 expression to S18. For WB, protein fold increase is normalized to B-actin or total AKT (pAKT). For the in vitro experiments, the data are the result of three experimental biological repeats; for the in vivo study, three mice were used for each group, and the experiment was repeated independently twice (total: 6 mice per group). Statistical analyses were conducted using one-sided two-sample t-tests (q-PCR) or two-sample unequal variance t-tests (BAL fluid cell numbers). Error bars indicate standard deviation. The symbol * indicates a statistically significant difference among groups with a P values <0.05. Images were acquired using an Olympus BX51 microscope with a 4× objective; scale bar is 100μm.

