
Figure 1).
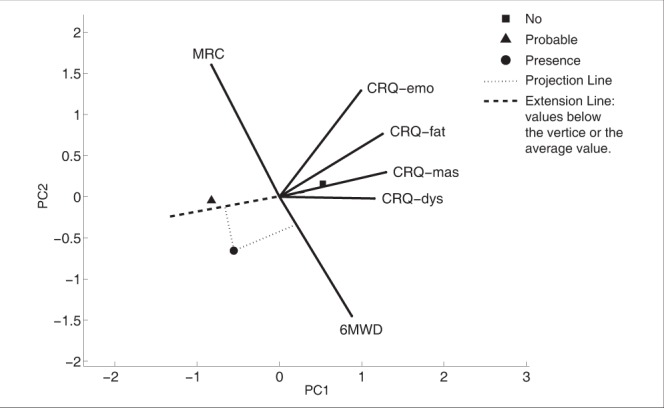
Principal component analysis biplot of the predictor variables and the average score of the groups for anxiety. The x-axis is represented by PC1 and the y-axis by PC2. The origin of the vectors indicates an average score for all variables. The vectors lines have a maximum length of 1 unit; the figure has been multiplied by a scale factor to enhance the image. A long solid line corresponds to a variable well represented in the dimensions. The angle between the vectors represents the correlation between the variables (ie, small angle implies a high correlation). The projection of each symbol on the vector line approximates the value of that variable for the symbol. All variables’ vectors were scaled by a constant factor such that the distances between groups and the vector lengths are on the same scale. 6MWD 6 min walk distance; CRQ Chronic Respiratory Disease Questionnaire; CRQ-dys CRQ Dyspnea; CRQ-emo CRQ Emotional function; CRQ-fat CRQ Fatigue; CRQ-mas CRQ Mastery; MRC Medical Research Council dyspnea scale